
Ultimate CORS Guide for Developers
Why CORS exists, how it works, and how to use it to properly setup cross-origin requests.

Why CORS exists, how it works, and how to use it to properly setup cross-origin requests.

Discover how to setup Eureka in AWS ECS following an example project.
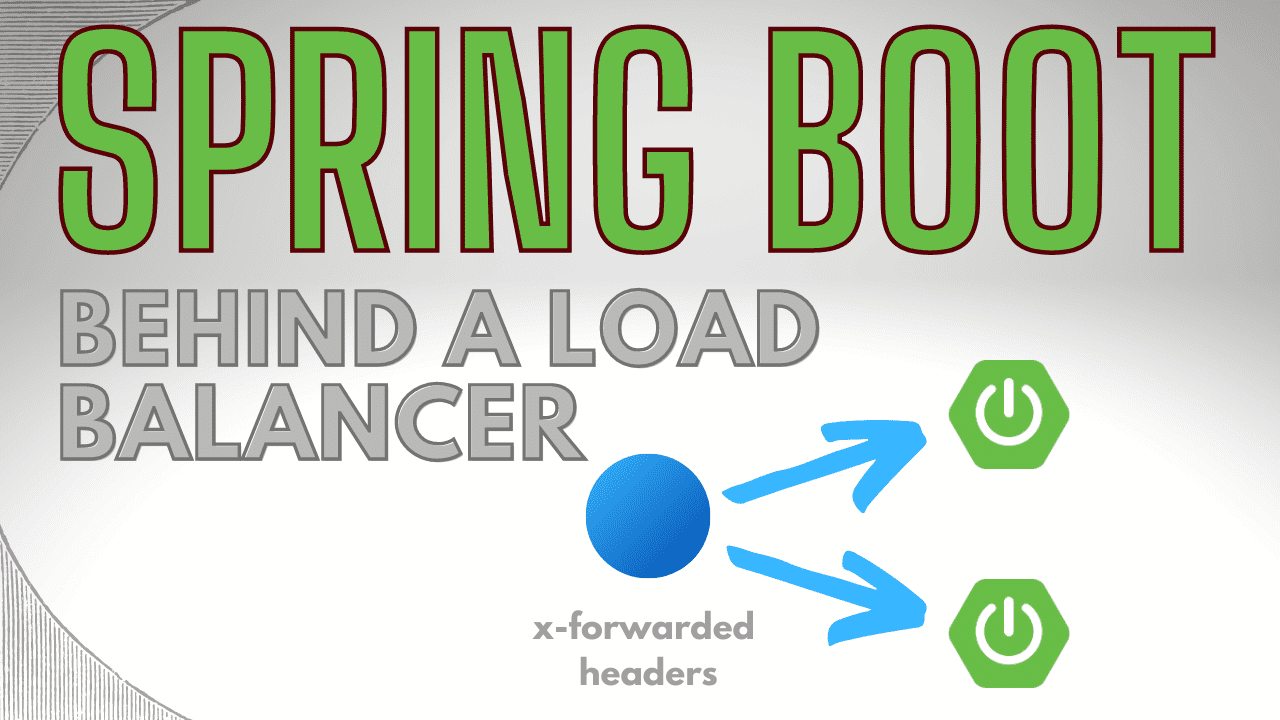
If you’ve ever deployed Spring Boot behind a load balancer, you might be aware of issues coming from differences between the request into the load balancer and the request into your application. These requests will often have a different protocol, host, or port. If Spring Boot isn’t correctly setup it can lead to all sorts of mayhem, such as generating incorrect URLs for you application. In this article you’ll discover how to make use of the X-Forwarded headers passed from a load balancer to your Spring Boot application, to help your application generate URLs correctly based on the originating request....

Spring Boot 2’s actuator module provides monitoring and management capabilities for your application, and includes the Micrometer metrics collection facility. Micrometer comes preconfigured with many useful default metrics, and also includes the ability for you to configure your own. In this article we’ll run through the most important default metrics provided in Spring Boot, and how you can use them to more effectively highlight problems within your application. Spring Boot Actuator and Micrometer overview The Spring Boot Actuator exposes many different monitoring and management endpoints over HTTP and JMX....
Once you’ve setup metrics for your application, and can query them and alert from them, when something goes wrong you need somewhere to go to quickly get a visual overview of what’s happening. In this article, you’ll discover how to setup a basic dashboard with Grafana, showing useful graphs to summarise the current state of a Spring Boot application. This is part 4, the final part of this series on monitoring a Spring Boot application....
When your application is exposing useful metrics about how it’s behaving, there’s no fun in constantly monitoring it for problems. Instead, you need to configure rules and alerts for when those rules are broken. In this article you’ll discover how to set up such a simple email alerting system for your Spring Boot application. This is part 3 in the series about monitoring a Spring Boot application. If you’re not yet familiar with Prometheus, be sure to check out part 2 where we discuss it in detail....
As part of a monitoring solution you’ll need a service to pull metrics from your applications, store them, and provide an easy way to query them. Prometheus is a tool which allows you to do all three. In this article you’ll learn all about Prometheus, how to set it up, point it to your application, and query it. If you want to see the high level overview of a complete monitoring solution for Spring Boot, check out last week’s blog post....
Being able to monitor a production application is fundamental in order to be alerted to any issues and quickly find a solution to problems. Many people seem to put in monitoring as an afterthought, or not at all. In this multi-part blog series you’ll discover how to setup monitoring, graphing, and alerting for a Spring Boot application. In part 1, you’ll get a birds eye view of the requirements involved in a complete monitoring solution....