Shipping AWS EC2 logs to CloudWatch with the CloudWatch agent

Want to learn how to monitor EC2 logs automatically without having to manually log into servers?
Well, in this article we'll explore how to setup the CloudWatch agent on an EC2 instance to easily stream your logs to AWS. We'll also setup a simple alarm for when the logs contain certain text that we want to watch out for, all within a worked example.
Why would you want to ship your EC2 logs to CloudWatch in the first place?
It's true that you can manually SSH into an EC2 instance to inspect the logs, but this has some serious drawbacks:
- the logs aren't backed up
- if the instance terminates you may lose those all-important logs
- there's no simple way to view the logs from all instances in one place
- it depends on someone logging in regularly to see if there's a problem
AWS CloudWatch solves all these problems, providing a centralised place to store logs, all accessible and searchable from the AWS console. It offers the following key benefits:
- logs are by default stored forever. You can configure the retention period as you like (1 month, 1 year, etc.)
- logs are searchable
- custom metrics and alarms can be generated by automatically matching patterns in the logs in real time
CloudWatch lingo A log event is an individual log line or statement A log stream represents all the log events that have come from a particular source, such as a specific log file on a particular EC2 instance A log group, on the other hand, represents a grouping of log streams which share the same settings e.g. retention time
EC2? Aren't we all about serverless and containers these days?
Well, yes, ideally we should be making use of serverless technologies such as AWS Lambda or microservice containers running in AWS ECS or EKS. There are, however, some occasions where we genuinely need to spin up EC2 instances. Here are a couple of them:
- Creating a bastion EC2 instance so you can get a network connection into a VPC to access private resources such as a database
- Migrating a pre-existing application into AWS. It may make sense to deploy the application first onto EC2, and then do the work to containerise it or move it to serverless.
If you do have a genuine use case for creating an EC2 instance, then make sure to use the AWS tools that allow you to surface and diagnose problems in the most effective way.
Understanding the CloudWatch agent
The best way to ship logs from an EC2 instance is to use the CloudWatch agent. This is a process that runs on the instance and can be configured to ship any logs (and metrics) to CloudWatch:
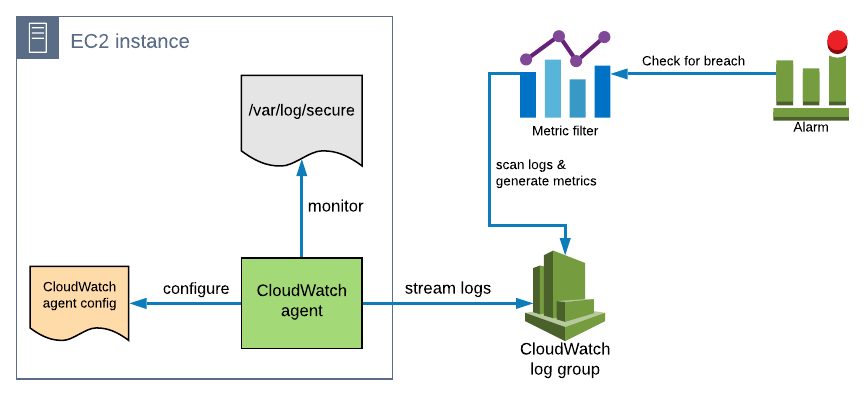
To get the agent working, you have to follow these steps, which are all covered in today's working example in the next section:
- role setup: configure a role attached to the EC2 instance to include the CloudWatchAgentServerPolicy managed policy. This allows the agent to push the logs to CloudWatch.
- agent installation: the agent can be installed using rpm (Red Hat package manager) and can be downloaded from an Amazon provided S3 bucket
- configuration: a JSON file must be supplied which defines the logs to be collected along with which log group they should be streamed to. The CloudWatch agent then sends log events to log streams it creates, following a naming convention that you specify.
Once all of this has been setup the CloudWatch agent will begin streaming new log lines as they appear in the configured log files.
Setting up the CloudWatch agent: a working example
To demonstrate how to use the CloudWatch agent to stream logs, we'll setup:
- an EC2 instance
- a CloudWatch agent on that instance that streams the /var/log/secure log file to CloudWatch. This log contains authentication information such as user logins and password changes.
We'll then access the CloudWatch service via the EC2 console to verify that we can see the logs.
Launch the example with CloudFormation
You can go ahead and setup today's working example by clicking the Launch Stack button below, or download the template directly.
It creates the following resources, some of which we'll describe in more detail shortly:
- a VPC
- a public subnet
- an internet gateway and route tables to provide internet access to any instance deployed in the subnet
- an IAM role with the already mentioned
CloudWatchAgentServerPolicy. We also provideAmazonSSMManagedInstanceCorepolicy in order that we can start a session in the instance using a Session Manager shell (more info later). - a log group
- an Amazon Linux 2 EC2 instance, containing:
- an initialisation script that installs the CloudWatch agent
- the CloudWatch agent configuration file
- all the configuration required for the agent to reload the config file when it gets updated
Installing the CloudWatch agent
In the CloudFormation template EC2Instance resource, we provide the following UserData property which defines a script to be run when the instance starts:
      UserData:
        # This script below is to install AmazonCloudWatchAgent, restart AmazonCloudWatchAgent and tell the result to cloudformation.
        Fn::Base64: !Sub |
          #!/bin/bash
          rpm -Uvh https://s3.amazonaws.com/amazoncloudwatch-agent/amazon_linux/amd64/latest/amazon-cloudwatch-agent.rpm
          /opt/aws/bin/cfn-init -v --stack ${AWS::StackId} --resource EC2Instance --region ${AWS::Region} --configsets default
          /opt/aws/bin/cfn-signal -e $? --stack ${AWS::StackId} --resource EC2Instance --region ${AWS::Region}
- the rpm command (Red Hat package manager) installs the CloudWatch agent from a location that Amazon makes available in S3
- we then call cfn-init which initialises any other files and commands that need to be installed on this instance
- cfn-signal then tells CloudFormation that the instance was successfully initialised
Configuring the CloudWatch agent
The CloudWatch agent config file is output to /opt/aws/amazon-cloudwatch-agent/etc/amazon-cloudwatch-agent.json and in our case consists of the following JSON:
{
   "logs":{
      "logs_collected":{
         "files":{
            "collect_list":[
               {
                  "file_path":"/var/log/secure",
                  "log_group_name":"${EC2LogGroup}",
                  "log_stream_name":"{instance_id}/var/log/secure"
               }
            ]
         }
      }
   }
}- collect_list is a list of elements, each of which represents one log file to be streamed to CloudWatch
- file_path is the log location on the file system of the EC2 instance
- log_group_name is the log group to use. We reference a resource created in a different section of the CloudFormation.
- log_stream_name is name format of the log stream to be created. We're using a combination of the instance id and log file name to keep it unique.
Viewing the logs in the CloudWatch console
Now you can follow these steps to see the /var/log/secure log file from the EC2 instance in the AWS console.
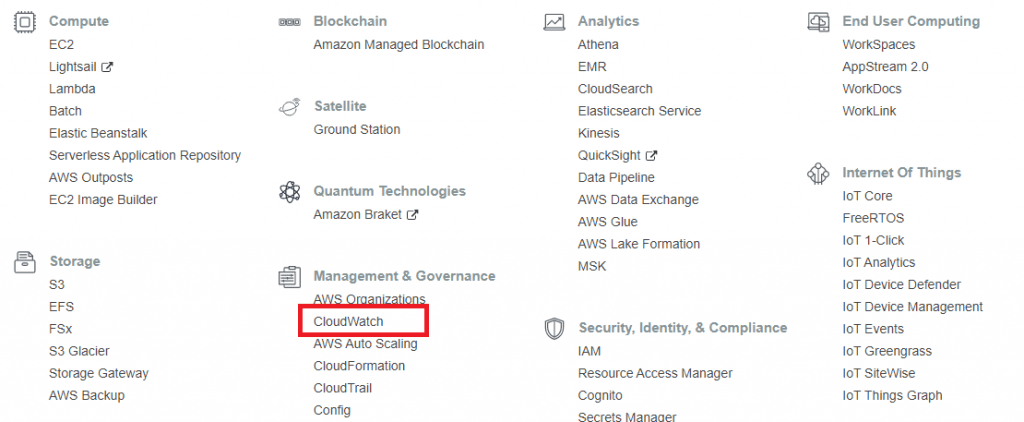
Go to Services, then search or select CloudWatch:
Click on Log groups in the left hand navigation, then select the ec2-instance log group:
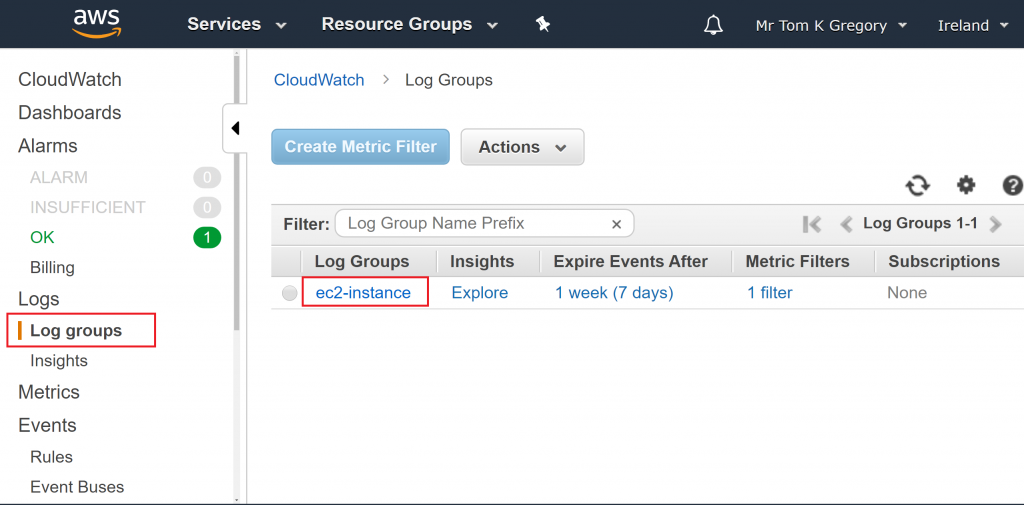
Now we're shown a list of log streams. There should be just one, so click on it:

Here, we can view and search the log events:
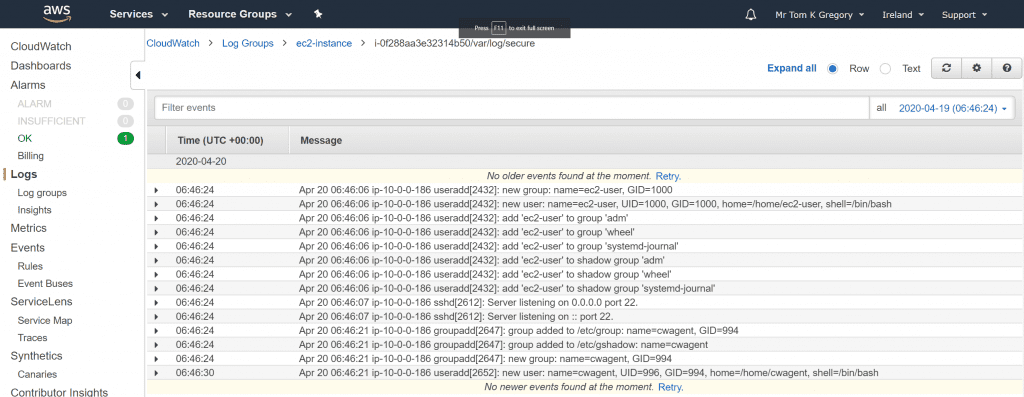
We can see log statements to do with setting up the ec2-user (the default user on an Amazon Linux 2 EC2 instance) and adding that user to various groups:
useradd[2432]: new user: name=ec2-user, UID=1000, GID=1000, home=/home/ec2-user, shell=/bin/bash
Verifying log updates are being streamed
Just for fun, let's log into the instance and change the ec2-user's password and make sure it shows up here. We can create a session in the instance using the Systems Manager (SSM) Session Manager tool, which allows direct access even without public access to port 22 for SSH.
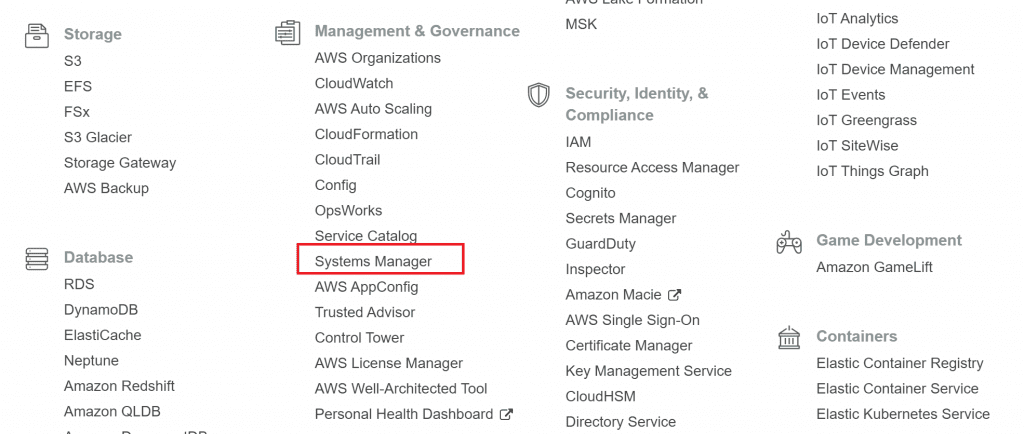
Go to Services and search or select Systems Manager:
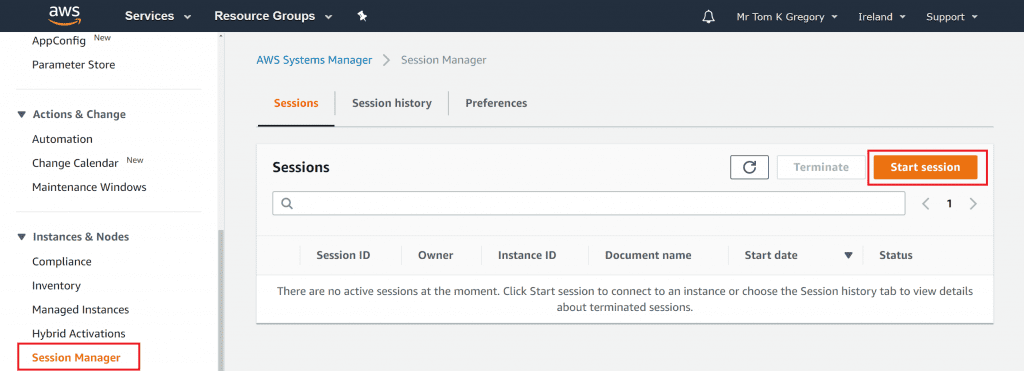
Select Session Manager from the navigation on the left. This page lists any current sessions. We want to create one, so click Start session:
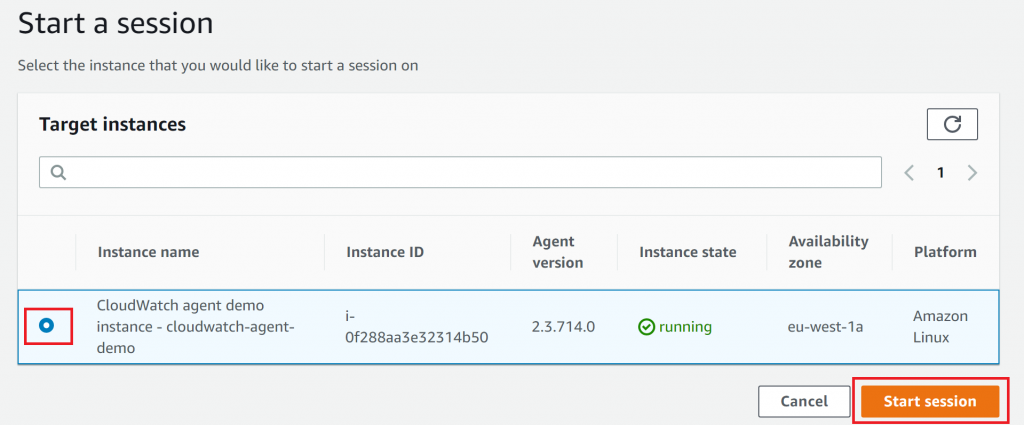
Select the CloudWatch agent demo instance, then click Start session. If your instance doesn't appear here, you may have to wait a few minutes:
A terminal window opens up allowing you to type in commands as though you had an SSH session open. Let's change the password of ec2-user with sudo passwd ec2-user:

Once you've typed in the new password twice this information should get logged in /var/log/secure and streamed to CloudWatch. Let's take a look. 🤞
Back in your CloudWatch log stream you should see something like this:

- sudo was run by ssm-user, which is the user you connect with when you're using Session Manager
- we started a session as the root user
- passwd was then executed to change the password of ec2-user
- the root user session was closed
Bonus: Automating log review with alarms
In a scenario where you need to know about password changes, manually checking the CloudWatch logs is going to become boring very quickly. Fortunately the clever folk at AWS have a solution for us with Metric Filters and Alarms. This allows the process to be automated and to receive an alert when someone changes their password on the EC2 instance.

Automated log review lingo A Metric Filter allows us to match text in incoming log streams and create metrics from the matches An Alarm checks the value of metrics, and when it breaches some threshold the alarm gets raised and can trigger certain actions (e.g. send email).
CloudFormation definition
Here's the CloudFormation for two additional resources, that sneakily I've already included in the CloudFormation template linked to earlier. 😈
The MetricFilter CloudFormation resource looks for any occurrence of the phrase 'password changed' and creates a metric called ChangePassword when one is found:
  MetricFilter:
    Type: AWS::Logs::MetricFilter
    Properties:
      LogGroupName: !Ref EC2LogGroup
      FilterPattern: 'password changed'
      MetricTransformations:
        -
          MetricValue: 1
          MetricNamespace: EC2
MetricName: ChangePassword- MetricNamespace is a group into which metrics are collected
- MetricName defines how the metric will be called in the MetricNamespace
The Alarm CloudFormation resource looks for any scenario when the ChangePassword metric is greater than or equal to a threshold of 1:
  Alarm:
    Type: AWS::CloudWatch::Alarm
    Properties:
      AlarmName: PasswordChangedAlarm
      MetricName: ChangePassword
      Namespace: EC2
      ComparisonOperator: GreaterThanOrEqualToThreshold
      EvaluationPeriods: 1
      Period: 60
      Statistic: Sum
      Threshold: 1
TreatMissingData: notBreaching- EvaluationPeriods is the number of times in a row that the comparison on the metric must return true, in order to trigger the alarm
- Period is the length of time over which the underlying metric is evaluated
- TreatMissingData defines what happens when there is no metric data for a specific time period. In our case we set it to notBreaching as our metric filter only generates a metric when it finds a log event that matches the pattern.
Trying out the alarm
Back in our Session Manager session let's change the password as we did in the earlier section. After some time, in the CloudWatch area of the AWS Console the alarm will be shown in red, meaning it's in the ALARM status:

Clicking on the alarm shows us that the ChangePassword metric was indeed greater than or equal to 1. After some time, the metric will go back to the OK status.
CloudWatch delays The CloudWatch agent streams logs to CloudWatch almost immediately. The MetricFilter takes a little longer to generate the metric from the matched log line though, so the Alarm may take a minute or two to surface.
Final thoughts
You've seen that it's straightforward to stream logs from an EC2 instance to CloudWatch, providing a robust logging solution. It's also worth bearing in mind that you can configure the CloudWatch agent to send metrics about your EC2 instance to CloudWatch too. This will allow you to monitor problems such as low disk space, high CPU usage, and much more.
AWS metric filters and alarms provide a way to be alerted when a log contains a certain piece of text that you're interested in. Consider extending today's example by configuring your alarm to use the Simple Notification Service. This way, you can get emailed every time the alarm fires, without having to constantly check the AWS console.
The article AWS SNS for CloudWatch alarm email notifications covers exactly this topic, following on from where we've left things here.
Resources
CloudFormation
(or download the template directly
CloudWatch agent documentation
See these docs to learn about other configuration options such as recording metrics
Video
If you prefer to learn in video format, check out this accompanying video to this post on the my YouTube channel.
If this is a problem you're dealing with in your own team, you can see how I approach software delivery in practice.
