The 4 Types Of Prometheus Metrics

Prometheus is an excellent tool for gathering metrics from your application so that you can better understand how it's behaving. When deciding how to publish metrics, you'll have 4 types of metrics to choose from. In this article you'll discover what are the different types of Prometheus metrics, how to decide which one is right for a specific scenario, and how to query them.
Overview
Prometheus is a standalone service which scrapes metrics from whatever applications you've configured. It's the job of the application to publish the metrics in the predefined format that Prometheus understands. We can then run queries against Prometheus to understand how our application is behaving.
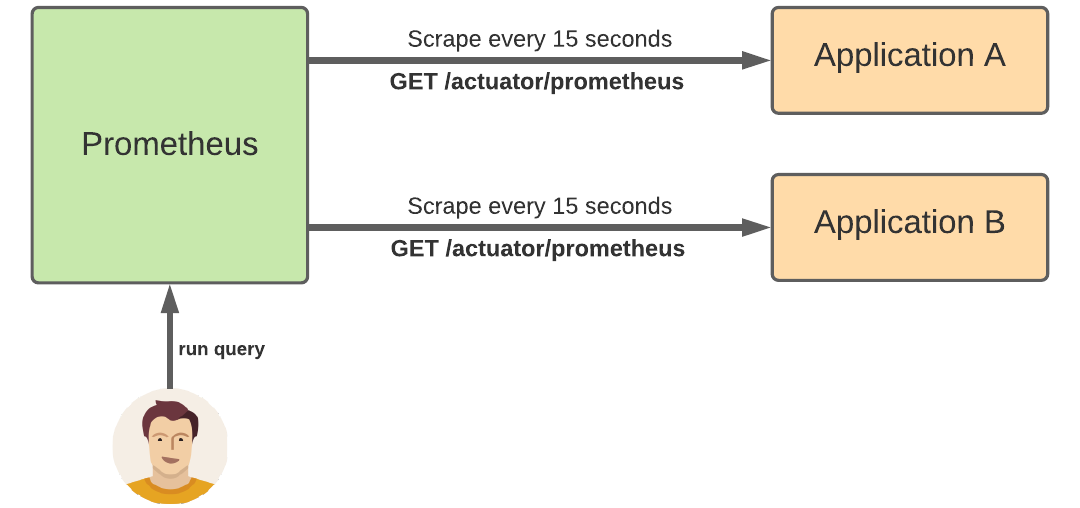
An example
Let's say I may want my application to publish a metric for the total number of requests it's processed. The application could expose an endpoint which returns the following response, to indicate that there have been 5 requests:
request_count 5.0
Assuming we have a Prometheus server that's scraping these metrics, we could then run the following queries:
-
request_countwould simply return 5 -
rate(request_count[5m])would return the per second rate of requests averaged over the last 5 minutes
This is the high level overview of how Prometheus gets it's metric data. But not all metrics are made the same. What if you wanted to record the request duration as well as count? Or maybe you want to record a value that goes up as well as down, such as queue size?
Metric types
Fortunately, Prometheus provides 4 different types of metrics which work in most situations, all wrapped up in a convenient client library. Currently, libraries exist for Go, Java, Python, and Ruby. Although we'll be looking at the Java version in this article, the concepts you'll learn will translate to the other languages too.
1. Counters
The counter metric type is used for any value that increases, such as a request count or error count. Importantly, a counter should never be used for a value that can decrease (for that see Gauges, below).
When to use counters?
-
you want to record a value that only goes up
-
you want to be able to later query how fast the value is increasing (i.e. it's rate)
What are some use cases for counters?
-
request count
-
tasks completed
-
error count
Java client for counters
The Java client library provides the Counter class (see Javadoc) which exposes these methods:
-
a
Counter.build()builder method -
public void inc()to increment the counter by 1 -
public void inc(double amt)to increment the counter by whatever double value you specify
Info: in Java, a double value holds a floating point value. The maximum value is 17 followed by 307 zeros.
Counter code example
package com.tom.controller;

import io.prometheus.client.CollectorRegistry;
import io.prometheus.client.Counter;
import org.springframework.web.bind.annotation.GetMapping;
import org.springframework.web.bind.annotation.RestController;

@RestController
public class CounterController {
    private final Counter requestCount;

    public CounterController(CollectorRegistry collectorRegistry) {
        requestCount = Counter.build()
                .name("request_count")
                .help("Number of hello requests.")
                .register(collectorRegistry);
    }

    @GetMapping(value = "/hello")
    public String hello() {
        requestCount.inc();

        return "Hi!";
    }
}
In this example, we have a Spring Boot controller class that exposes a GET endpoint at /hello. We want to record the number of times this endpoint gets hit, so have added:
-
a constructor which initialises an instance of
Counterand binds it to the Spring Boot defaultCollectorRegistry. You can think of theCollectorRegistryas the central place where all the metrics are stored. -
a call to
inc()when we want to increment the counter
How does Prometheus expose counters?
If you browse to /actuator/prometheus you can see the metric exposed like this:
# TYPE request_count counter
request_count 15.0
Info: by default Prometheus includes the configured help text and metric type for informational purposes
How can I query counters in Prometheus?
We can use the following query to calculate the per second rate of requests averaged over the last 5 minutes:
rate(request_count[5m])
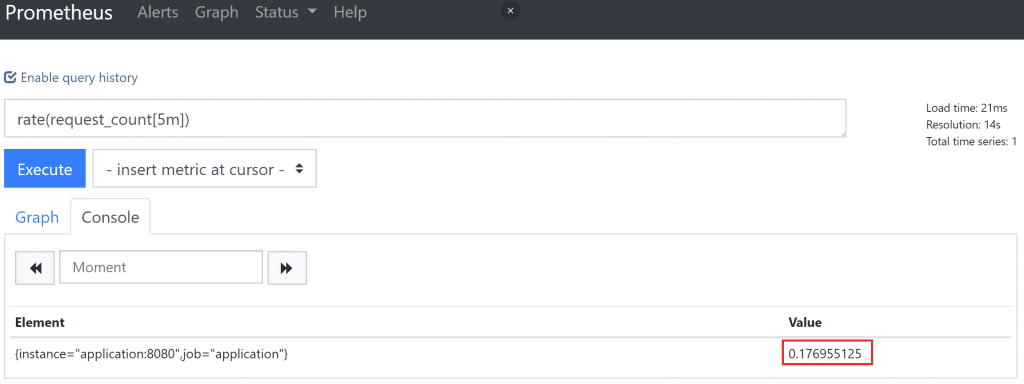
Info: the rate function calculates the per second rate of increase averaged over the provided time interval. It can only be used with counters.
2. Gauges
The gauge metric type can be used for values that go down as well as up, such as current memory usage or the number of items in a queue.
When to use gauges?
-
you want to record a value that can go up or down
-
you don't need to query its rate
What are some use cases for gauges?
-
memory usage
-
queue size
-
number of requests in progress
Java client for gauges
The Java client library provides the Gaugeclass (see Javadoc) which exposes the following methods:
-
a
Gauge.build()builder method -
public void inc()to increment the metric by 1 -
public void inc(double amt)to increment the metric by whatever double value you specify -
public void dec()to decrement the metric by 1 -
public void dec(double amt)to decrement the metric by whatever double value you specify -
public void set(double val)to set the metric to whatever double value you specify
Gauge code example
package com.tom.controller;

import io.prometheus.client.CollectorRegistry;
import io.prometheus.client.Gauge;
import org.springframework.web.bind.annotation.GetMapping;
import org.springframework.web.bind.annotation.RestController;

@RestController
public class GaugeController {
    private final Gauge queueSize;

    public GaugeController(CollectorRegistry collectorRegistry) {
        queueSize = Gauge.build()
                .name("queue_size")
                .help("Size of queue.")
                .register(collectorRegistry);
    }

    @GetMapping(value = "/push")
    public String push() {
        queueSize.inc();

        return "You pushed an item to the queue!";
    }

    @GetMapping(value = "/pop")
    public String pop() {
        queueSize.dec();

        return "You popped an item from the queue!";
    }
}
In this example, we have another Spring Boot controller which exposes /push and /pop endpoints, to simulate adding and removing items from a queue. We want to record the size of the queue, so have added:
-
a constructor which initialises an instance of
Gaugeand binds it to the Spring Boot defaultCollectorRegistry -
a call to
inc()when we push an item to the queue -
a call to
dec()when we pop an item off the queue
How does Prometheus expose gauges?
If you browse to /actuator/prometheus you can see the metric exposed like this:
# HELP queue_size Size of queue.
# TYPE queue_size gauge
queue_size 3.0
How can I query gauges in Prometheus?
We can use the following query to calculate the average queue size over the last 5 minutes:
avg_over_time(queue_size[5m])
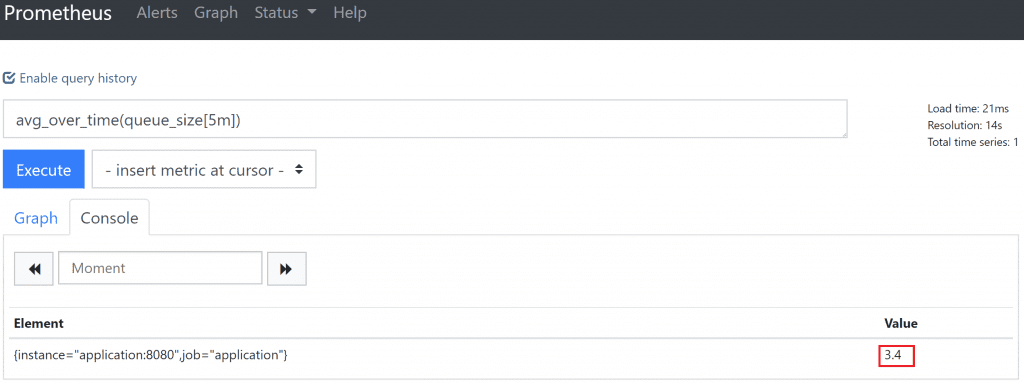
Note that we can't use the rate function with a gauge, as it only works with values that go up (i.e. counters).
3. Histograms
The histogram metric type measures the frequency of value observations that fall into specific predefined buckets.
For example, you could measure request duration for a specific HTTP request call using histograms. Rather than storing every duration for every request, Prometheus will make an approximation by storing the frequency of requests that fall into particular buckets.
By default, these buckets are: .005, .01, .025, .05, .075, .1, .25, .5, .75, 1, 2.5, 5, 7.5, 10. This is very much tuned to measuring request durations below 10 seconds, so if you're measuring something else you may need to configure custom buckets.
When to use histograms?
-
you want to take many measurements of a value, to later calculate averages or percentiles
-
you're not bothered about the exact values, but are happy with an approximation
-
you know what the range of values will be up front, so can use the default bucket definitions or define your own
What are some use cases for histograms?
-
request duration
-
response size
Java client for histograms
The Java client library provides the Histogramclass (see Javadoc) which exposes these methods:
-
a
Histogram.build()builder method. You can also call thebuckets(double... buckets)method to define your own custom bucket thresholds rather than use the defaults described above. -
public Timer startTimer()which returns aHistogram.Timerobject. When you're ready to finish timing, call theobserveDuration()method on it (see example below). -
public void observe(double amt)which will record whatever double value you pass it -
public double time(Runnable timeable)executes theRunnableand measures how long it took to execute. The same definition also exists forCallable.
Histogram code example
package com.tom.controller;

import io.prometheus.client.CollectorRegistry;
import io.prometheus.client.Histogram;
import org.springframework.web.bind.annotation.GetMapping;
import org.springframework.web.bind.annotation.RestController;

import static java.lang.Thread.sleep;

@RestController
public class HistogramController {
    private final Histogram requestDuration;

    public HistogramController(CollectorRegistry collectorRegistry) {
        requestDuration = Histogram.build()
                .name("request_duration")
                .help("Time for HTTP request.")
                .register(collectorRegistry);
    }

    @GetMapping(value = "/wait")
    public String makeMeWait() throws InterruptedException {
        Histogram.Timer timer = requestDuration.startTimer();

        long sleepDuration = Double.valueOf(Math.floor(Math.random() * 10 * 1000)).longValue();
        sleep(sleepDuration);

        timer.observeDuration();

        return String.format("I kept you waiting for %s ms!", sleepDuration);
    }
}
In this example, we have another Spring Boot controller which exposes the /wait endpoint, which waits a random amount of time between 0 and 10,000 ms (10 seconds). This way, we can simulate different request durations. We want to record the request duration, so have added:
-
a constructor which initialises an instance of
Histogramand binds it to the Spring Boot defaultCollectorRegistry -
a call to
startTimer()which returns aHistogram.Timerinstance -
a call to
observeDuration()on theHistogram.Timerinstance to record the metric
How does Prometheus expose histograms?
Given I made 3 requests to /wait that took 4.467s, 9.213s, and 9.298s, the Prometheus client exposes the following at /actuator/prometheus.
# HELP request_duration Time for HTTP request.
# TYPE request_duration histogram
request_duration_bucket{le="0.005",} 0.0
request_duration_bucket{le="0.01",} 0.0
request_duration_bucket{le="0.025",} 0.0
request_duration_bucket{le="0.05",} 0.0
request_duration_bucket{le="0.075",} 0.0
request_duration_bucket{le="0.1",} 0.0
request_duration_bucket{le="0.25",} 0.0
request_duration_bucket{le="0.5",} 0.0
request_duration_bucket{le="0.75",} 0.0
request_duration_bucket{le="1.0",} 0.0
request_duration_bucket{le="2.5",} 0.0
request_duration_bucket{le="5.0",} 1.0
request_duration_bucket{le="7.5",} 1.0
request_duration_bucket{le="10.0",} 3.0
request_duration_bucket{le="+Inf",} 3.0
request_duration_count 3.0
request_duration_sum 22.978489699999997
Here you can see the buckets mentioned before in action. The request_duration_bucket metric has a label le to specify the maximum value that falls within that bucket.
The 4.467s response falls into the {le="5.0",} bucket (less than or equal to 5 seconds), which has a frequency of 1. It also falls into all the other larger bucket sizes, which also have their frequency increased by 1. The 2 requests that took just over 9s fall into the {le="10.0",} and {le="+Inf",} buckets, which have a frequency of 2 + 1 = 3.
Note that the histogram metric type also records a count of the number of observations (request_duration_count) and a sum of the observations (request_duration_sum). This allows the calculation of averages and percentiles.
How can I query histograms in Prometheus?
We can use the following query to calculate the average request duration within the last 5 minutes:
rate(request_duration_sum[5m])
/
rate(request_duration_count[5m])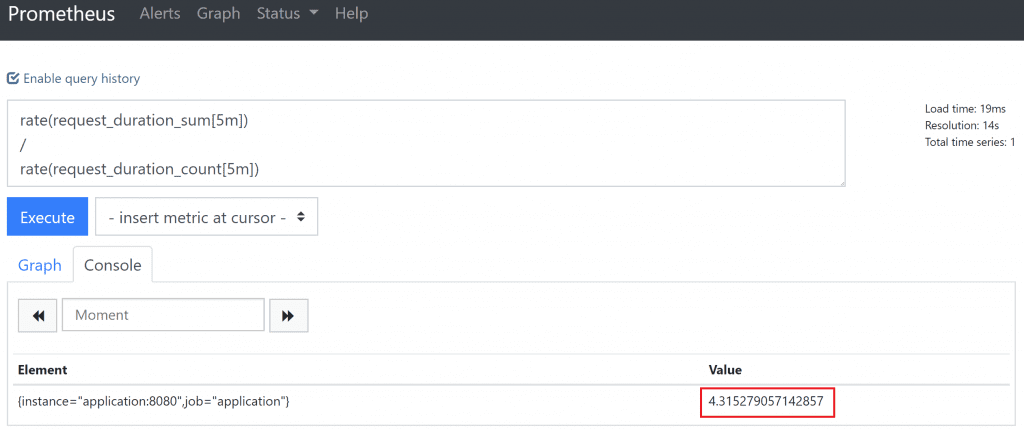
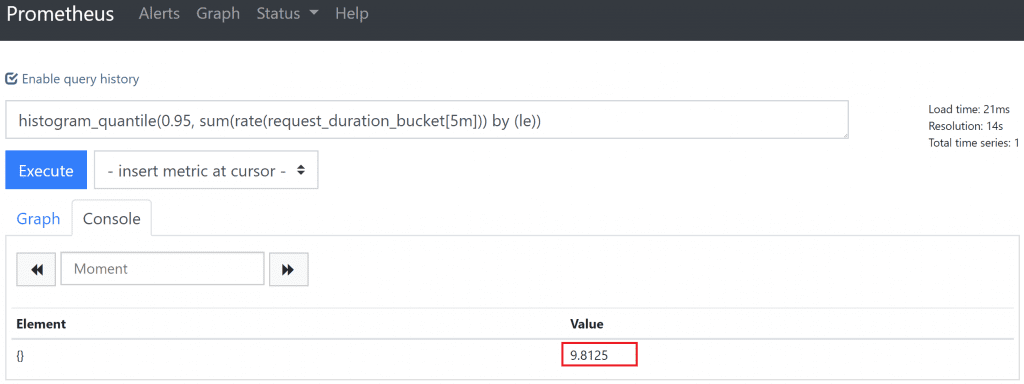
The histogram metric also allows us to calculate percentiles, which we can do using the built in histogram_quantile function. We can calculate the 95th percentile (i.e. the 0.95 quantile) in the last 5 minutes with this function:
histogram_quantile(0.95, sum(rate(request_duration_bucket[5m])) by (le))
4. Summaries
Summaries and histograms share a lot of similarities. Summaries preceded histograms, and the recommendation is very much to use histograms where possible. It's worth noting these key differences between histograms and summaries:
-
with histograms, quantiles are calculated on the Prometheus server. With summaries, they are calculated on the application server.
-
therefore, summary data cannot be aggregated from a number of application instances
-
histograms require up front bucket definition, so suit the use case where you have a good idea about the spread of your values
-
summaries are a good option if you need to calculate accurate quantiles, but can't be sure what the range of the values will be
Check out the Prometheus documentation for a full side-by-side comparison of histograms and summaries.
When to use summaries?
-
you want to take many measurements of a value, to later calculate averages or percentiles
-
you’re not bothered about the exact values, but are happy with an approximation
-
you don't know what the range of values will be up front, so cannot use histograms
What are some use cases for summaries?
-
request duration
-
response size
Java client for summaries
The Java client library provides the Summary class (see Javadoc) which exposes these methods:
-
a
Summary.build()builder method. You have to specify which quantiles you want to measure at this point by calling thequantilemethod (see example below). -
public Timer startTimer()which returns aSummary.Timerobject. When you're ready to finish timing, call theobserveDuration()method on it (see example below). -
public void observe(double amt)which will record whatever double value you pass it -
public double time(Runnable timeable)executes theRunnableand measures how long it took to execute. The same definition also exists forCallable.
Summary code example
package com.tom.controller;

import io.prometheus.client.CollectorRegistry;
import io.prometheus.client.Summary;
import org.springframework.web.bind.annotation.GetMapping;
import org.springframework.web.bind.annotation.RestController;

import static java.lang.Thread.sleep;

@RestController
public class SummaryController {
    private final Summary requestDuration;

    public SummaryController(CollectorRegistry collectorRegistry) {
        requestDuration = Summary.build()
                .name("request_duration_summary")
                .help("Time for HTTP request.")
                .quantile(0.95, 0.01)
                .register(collectorRegistry);
    }

    @GetMapping(value = "/waitSummary")
    public String makeMeWait() throws InterruptedException {
        Summary.Timer timer = requestDuration.startTimer();

        long sleepDuration = Double.valueOf(Math.floor(Math.random() * 10 * 1000)).longValue();
        sleep(sleepDuration);

        timer.observeDuration();

        return String.format("I kept you waiting for %s ms!", sleepDuration);
    }
}
In this example, we have another Spring Boot controller which exposes the /waitSummary endpoint, which also waits a random amount of time between 0 and 10,000 ms (10 seconds). We want to record the request duration, so have added:
-
a constructor which initialises an instance of
Histogramand binds it to the Spring Boot defaultCollectorRegistry. We are also registering a single quantile to record of 0.95 (i.e. the 95th percentile), with an error threshold of 0.01 -
a call to
startTimer()which returns aHistogram.Timerinstance -
a call to
observeDuration()on theHistogram.Timerinstance to record the metric
How does Prometheus expose summaries?
If you browse to /actuator/prometheus you can see the metric exposed like this:
# HELP request_duration_summary Time for HTTP request.
# TYPE request_duration_summary summary
request_duration_summary{quantile="0.95",} 7.4632192
request_duration_summary_count 5.0
request_duration_summary_sum 27.338737899999998
Here you can see that Prometheus is only exposing the quantiles which we have requested (0.95). With a summary, there is no way to calculate any other quantiles within Prometheus after the values have been recorded.
How can I query summaries in Prometheus?
We can use a similar query as we used for the histogram, to calculate the average request duration within the last 5 minutes:
rate(request_duration_summary_sum[5m])
/
rate(request_duration_summary_count[5m])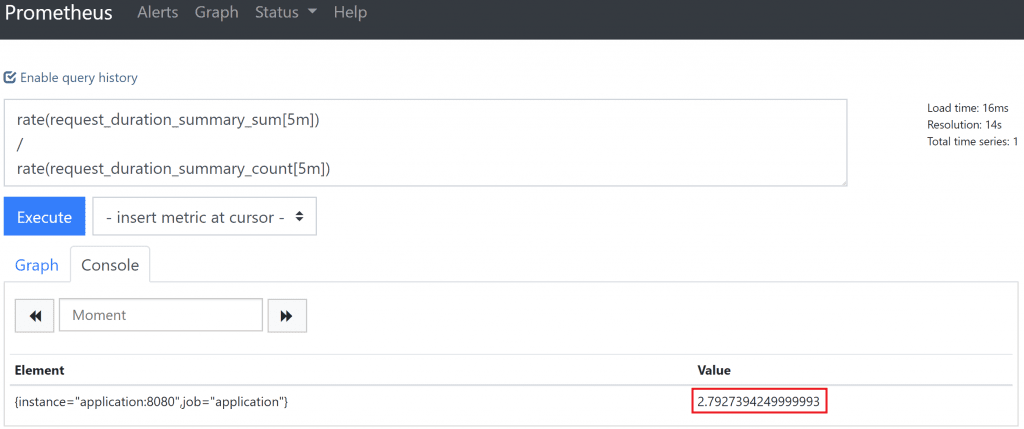
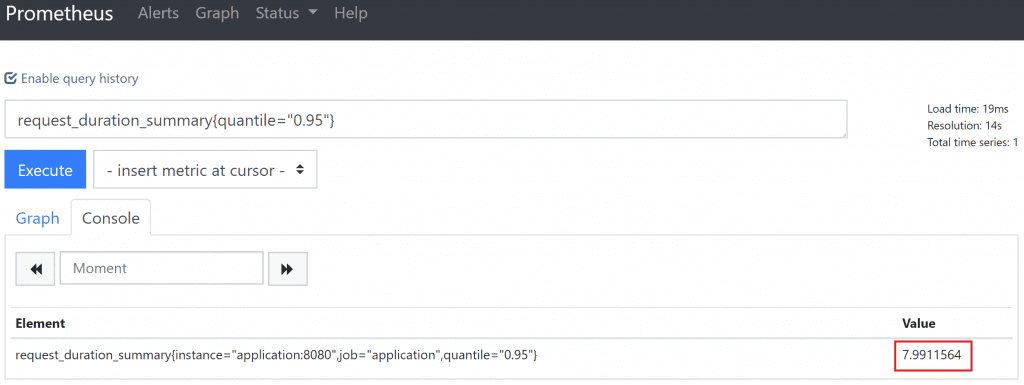
With a summary which has a predefined quantile, we just need to run this query to get the current 95th percentile:
request_duration_summary{quantile="0.95"}
 )
)
Metric type comparison table
| Counter | Gauge | Histogram | Summary | |
|---|---|---|---|---|
| General | ||||
| Can go up and down | ✗ | ✓ | ✓ | ✓ |
| Is a complex type (publishes multiple values per metric) | ✗ | ✗ | ✓ | ✓ |
| Is an approximation | ✗ | ✗ | ✓ | ✓ |
| Querying | ||||
| Can query with rate function | ✓ | ✗ | ✗ | ✗ |
| Can calculate percentiles | ✗ | ✗ | ✓ | ✓ |
| Can query with histogram_quantile function | ✗ | ✗ | ✓ | ✗ |
Conclusion
Now you should have a clear understanding about the different metric types you can use in Prometheus, when to use them, and how to query them. With this knowledge, you can more effectively publish metrics from your application and ensure it's always running as expected.
Resources
-
the Prometheus docs on the different metric types
-
an in depth comparison of histograms and summaries
-
the list of the different Prometheus query functions
If you prefer to learn in video format, check out this accompanying video on the my YouTube channel.
If this is a problem you're dealing with in your own team, you can see how I approach software delivery in practice.