
Spring Boot has 50+ libraries available to add to your application.
With so much functionality, how do you know you’re not missing critical features that could avoid hours of wasted development?
My answer was to spend way too long browsing official docs.
But after a few years I did uncover some hidden gems my colleagues never knew existed. Here are my favourites to help you save time and eliminate unnecessary code.
1. Supercharge your dev workflow
Every time you change a line of code to see what difference it makes to a Java Spring Boot application, you need to manually shutdown and restart the whole server.
Slow and painful.
But did you know there’s a library that detects changes to compiled Java code and automatically restarts for you?
You add spring-boot-devtools in your Gradle build script (build.gradle.kts or build.gradle).
It’s just a one line change, so there’s no excuse not to use it.
dependencies {
    // other dependencies
    developmentOnly("org.springframework.boot:spring-boot-devtools:3.2.4")
}
To pick up spring-boot-devtools, restart the server.
Now any code changes must first be compiled in IntelliJ IDEA with Ctrl + F9 in Windows or ⌘ F9 on Mac.
The library then detects the classpath change and automatically does an extra-fast restart.
Even in tiny projects that saves a few seconds whenever you need to test a change.
2. No more dead servers
When the boss calls asking why there were no new sales today on the company website, what are you going to do?
Maybe rush to view the application logs, only to see your Spring Boot server has been shutdown for hours, breaking the entire website.
Wouldn’t it be better to have confidence your server is up and running any time of day or night? That’s why it’s so important to enable your Spring Boot application’s health endpoint.
The health endpoint is an easy way for you or an automated service to check the application’s status.
Enable it in your Gradle build script by adding a dependency on spring-boot-starter-actuator,
which adds useful monitoring tools to your application.
dependencies {
    // other dependencies
    implementation("org.springframework.boot:spring-boot-starter-actuator:3.2.4")
}
Also add this property to your application.properties file.
management.endpoints.web.exposure.include=health
Now your application exposes an /actuator/health endpoint which returns this JSON response.
{
  "status": "UP"
}
By default, the status is based on:
- Application responsiveness (PingHealthIndicator)
- Disk space availability (DiskSpaceHealthIndicator)
There are 15 other health indicators that are switched on depending on which Spring Boot features you use.
Rather than checking this endpoint manually, setup a service to do it automatically and notify you of problems. I discuss one option later in the article.
3. One line Spring Boot update
Did you notice I added the library in the Gradle build script earlier with a specific version number? That’s the latest Spring Boot version at the time of writing.
But with this kind of setup, when you want to update Spring Boot you have to change multiple lines and might make a mistake.
Here’s an example of what I mean.
dependencies {
    implementation("org.springframework.boot:spring-boot-starter-web:3.2.4")
    implementation("org.springframework.boot:spring-boot-starter-actuator:3.2.4")
    developmentOnly("org.springframework.boot:spring-boot-devtools:3.2.4")
}
That’s why you need to enable the Spring Dependency Management plugin. This Gradle plugin works alongside the Spring Boot plugin to add all kinds of helpful tools to your project.
To enable it, include the plugin id in your Gradle build script.
plugins {
    java
    id("org.springframework.boot") version "3.2.4"
    id("io.spring.dependency-management") version "1.1.4"
}
Now you can delete the Spring Boot version from your dependencies, removing duplication.
dependencies {
    implementation("org.springframework.boot:spring-boot-starter-web")
    implementation("org.springframework.boot:spring-boot-starter-actuator")
    developmentOnly("org.springframework.boot:spring-boot-devtools")
}
The Spring Dependency Management plugin takes the Spring Boot version from the Spring Boot plugin version, and uses it to configure your library versions.
In this example, it’s 3.2.4.
plugins {
    java
    id("org.springframework.boot") version "3.2.4"
    id("io.spring.dependency-management") version "1.1.4"
}
This means updating the Spring Boot version is now a one-line change, avoiding mistakes that could lead to library version conflicts.
4. An ID card for your application
When you find a bug in a deployed Spring Boot application, the first thing you need to know is its version. Without that, you have no idea what code to run locally to reproduce the bug and try to fix it.
Don’t waste time creating your own endpoint to publish this information. Instead, add whatever details you need to Spring Boot’s info endpoint.
The info endpoint is another /actuator endpoint (like the health endpoint) and can be configured to include whatever details you need.
Enable the info endpoint in your application.properties file.
management.endpoints.web.exposure.include=health,info
After rebuilding, you can now access the /actuator/info endpoint, which is by default empty.
{ }
A good starting point is to expose your application’s version and build time.
In your Gradle build script, configure the Spring Boot plugin to generate build info.
springBoot {
    buildInfo()
}
Now your Gradle build creates a build/resources/main/build-info.properties file, which gets picked up by Spring Boot and exposed on the /actuator/info endpoint.
{
  "build": {
    "artifact": "title-generator",
    "name": "title-generator",
    "time": "2024-04-17T09:44:05.996Z",
    "version": "199"
  }
}
As long as you tag your Git repo with the version, this information means you immediately know what code any application server is running.
5. How to measure everything
Even if you’re sure your Spring Boot application is running, diagnosing issues can be a nightmare if you don’t know what’s happening inside.
- number of HTTP requests
- memory usage
- uptime
These are all factors that point you to the source of a problem, so you can proactively fix it instead of restarting the server and hoping for the best.
That’s why enabling Spring Boot metrics is essential for developers who want the best experience for their users.
Spring Boot constantly collects data about your application.
Metrics is another type of /actuator endpoint which exposes this data for you or an automated service to read.
Enable the metrics endpoint in your application.properties file.
management.endpoints.web.exposure.include=health,info,metrics
After rebuilding, go to /actuator/metrics/ to see all available metrics.
{
  "names": [
    "application.ready.time",
    "application.started.time",
    "disk.free",
    "disk.total",
    "executor.active",
    "executor.completed",
    "executor.pool.core",
    "executor.pool.max",
    "executor.pool.size",
    "executor.queue.remaining",
    "executor.queued",
    "http.server.requests",
    "http.server.requests.active",
    "jvm.buffer.count",
    "jvm.buffer.memory.used",
    "jvm.buffer.total.capacity",
    "jvm.classes.loaded",
    "jvm.classes.unloaded",
    "jvm.compilation.time",
    "jvm.gc.concurrent.phase.time",
    "jvm.gc.live.data.size",
    "jvm.gc.max.data.size",
    "jvm.gc.memory.allocated",
    "jvm.gc.memory.promoted",
    "jvm.gc.overhead",
    "jvm.gc.pause",
    "jvm.info",
    "jvm.memory.committed",
    "jvm.memory.max",
    "jvm.memory.usage.after.gc",
    "jvm.memory.used",
    "jvm.threads.daemon",
    "jvm.threads.live",
    "jvm.threads.peak",
    "jvm.threads.started",
    "jvm.threads.states",
    "logback.events",
    "process.cpu.usage",
    "process.start.time",
    "process.uptime",
    "system.cpu.count",
    "system.cpu.usage",
    "tomcat.sessions.active.current",
    "tomcat.sessions.active.max",
    "tomcat.sessions.alive.max",
    "tomcat.sessions.created",
    "tomcat.sessions.expired",
    "tomcat.sessions.rejected"
  ]
}
Let’ say we’re interested in memory usage, so want to inspect the jvm.memory.used metric.
Go to /actuator/metrics/jvm.memory.used to see the details.
{
  "name": "jvm.memory.used",
  "description": "The amount of used memory",
  "baseUnit": "bytes",
  "measurements": [
    {
      "statistic": "VALUE",
      "value": 9.4137288E7
    }
  ],
  "availableTags": [
    {
      "tag": "area",
      "values": [
        "heap",
        "nonheap"
      ]
    },
    {
      "tag": "id",
      "values": [
        "G1 Survivor Space",
        "Compressed Class Space",
        "Metaspace",
        "CodeCache",
        "G1 Old Gen",
        "G1 Eden Space"
      ]
    }
  ]
}
There’s too much information here to monitor manually. So use an automated service like Prometheus to poll the metrics and generate graphs that help you understand what’s happening. I wrote this article to help you setup Prometheus correctly for Spring Boot.
When you have metrics in place, it’s much easier to identify the source of a problem in your production application.
6. Joyful application configuration
Using the @Value annotation, you can inject property values into your Spring Boot application to use in code — great for feature flags and anything that changes per environment.
For example, this controller uses a superduper property to enable a specific feature.
@RestController
public class TitleGeneratorController {
    private final TitleGeneratorService titleGeneratorService;
    private final boolean superDuper;

    public TitleGeneratorController(TitleGeneratorService titleGeneratorService, @Value("${superduper:false}") boolean superDuper) {
        this.titleGeneratorService = titleGeneratorService;
        this.superDuper = superDuper;
    }

    // ...
}
On your local machine, changing these is as simple as updating a properties file and restarting the application. In other environments (like production), updating the same properties file can mean rebuilding and redeploying the whole application.
That could take hours, depending on your process.
Wouldn’t it be better if you could update properties fast without making any changes to the application at all?
That’s why developers building serious Spring Boot applications need to use Externalized Configuration. That’s just a fancy name for defining properties outside your Spring Boot jar file, and there are loads of ways to do that.
We’ll look at 3 of them from the context of configuring the properties of a Spring Boot jar file we run from the command line with java -jar <jar-file-location>.
a) External application.properties
Create an application.properties file in the same directory from which you run the jar file.
superduper=true
Spring Boot picks up these properties and combines them with the application.properties inside the jar file.
In this case, the application’s superduper mode gets enabled.
b) Environment variables
You can supply properties to Spring Boot using environment variables.
One way to pass an environment variable to your application is by prepending the java command with a key/value pair.
SUPERDUPER=true java -jar <jar-file-location>
Spring Boot picks up the environment variable, enabling superduper mode.
c) Spring Cloud Config
The best approach for larger projects is to store your application configuration in a separate GitHub repository.
The advantages of this are:
- Version controlled properties
- Easy updates with a simple commit
- No application restart needed (using Spring Cloud Config)
Spring Cloud Config is a separate service you run that reads configuration from a Git repository.
Your application then polls this service to fetch the latest configuration at startup time or when you hit /actuator/refresh.
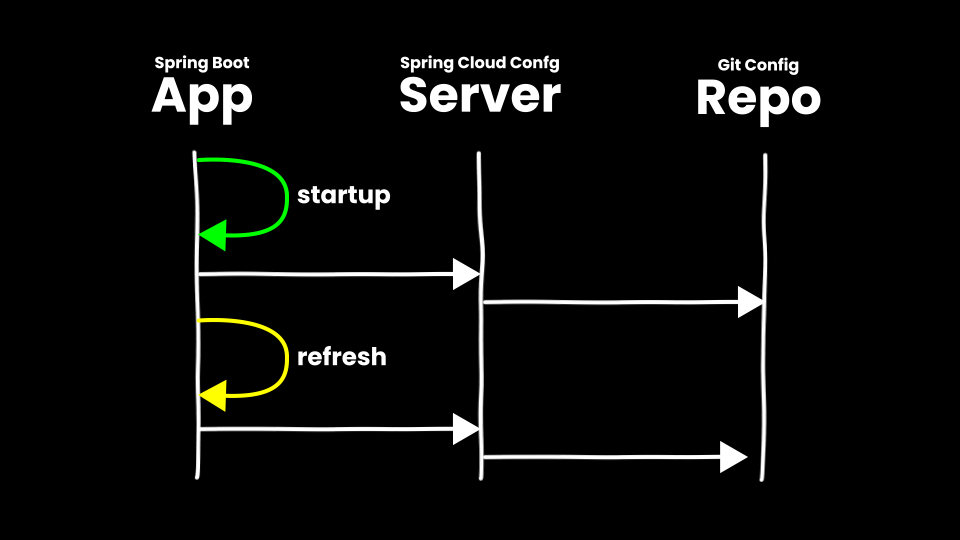
Spring Cloud Config overview
To learn how to setup Spring Cloud Config check out the official docs.
Whatever option you choose, using external configuration helps you configure your application more dynamically.
7. Simple Spring Boot with Docker
Any developer who hates buggy applications should absolutely run Spring Boot using Docker.
With Docker, an application runs inside a container, which is like a virtual machine and guarantees your code runs the same way every time — especially important in production.
To use Docker, you add the Spring Boot jar file into a Docker image. You can then run that image whenever you need.
The only problem is, you have to define yourself what goes in the image using a Dockerfile.
FROM openjdk:11
ARG JAR_FILE
COPY ${JAR_FILE} app.jar
ENTRYPOINT ["java", "-jar", "/app.jar"]
To avoid writing a Dockerfile, you can instead use the Docker tools that come with the Spring Boot plugin to automate the whole process — a single Gradle command to build and publish the image.
The Spring Boot Gradle plugin adds the bootBuildImage task. To use it, you must have Docker installed locally, like Docker Desktop.
With that setup, run the task from your IDE or command line.
./gradlew bootBuildImage
This generates a Docker image which you see by running docker images.
$ docker images
REPOSITORY                            TAG             IMAGE ID       CREATED         SIZE
title-generator                       199             86cdaa7c7a40   44 years ago    367MB
Run the image, exposing the default Spring Boot port 8080, and see it behave like any Spring Boot application.
$ docker run -p 8080:8080 title-generator:199
...
  .   ____          _            __ _ _
 /\\ / ___'_ __ _ _(_)_ __  __ _ \ \ \ \
( ( )\___ | '_ | '_| | '_ \/ _` | \ \ \ \
 \\/  ___)| |_)| | | | | || (_| |  ) ) ) )
  '  |____| .__|_| |_|_| |_\__, | / / / /
 =========|_|==============|___/=/_/_/_/
 :: Spring Boot ::                (v3.2.4)
...
Publishing to a Docker registry
The bootBuildImage task can also publish your image to a remote Docker registry — a storage location for Docker images that you want to easily access.
First configure the bootBuildImage task in your Gradle build script with the relevant image name and credentials .
tasks.named<BootBuildImage>("bootBuildImage") {
    docker {
        imageName.set("my-username/${project.name}")
        publishRegistry {
            username = "my-username"
            password = project.property("dockerPassword").toString()
        }
    }}
Now run the Gradle task again, passing the --publishImage argument.
./gradlew bootBuildImage --publishImage
This builds the image then uploads it to your remote Docker registry, ready to deploy wherever you want.
Those were my top 7 less-known Spring Boot features. Did you learn something to make developing Spring Boot applications more enjoyable?
Stop reading Gradle articles like these
This article helps you fix a specific problem, but it doesn't teach you the Gradle fundamentals you need to really help your team succeed.
Instead, follow a step-by-step process that makes getting started with Gradle easy.