Integration Test Code Coverage with SonarQube and Jacoco

It's hepful to separate integration tests from unit tests in a Java project to run them independently. But how do you generate a combined code coverage metric? In this article you'll discover exactly how, with a full example project which publishes Jacoco code coverage stats to SonarQube.
Code coverage for unit tests
A code coverage metric tells you what percentage of your proudction code is covered by tests. The higher the better.
Jacoco is a tool which generates such metrics.
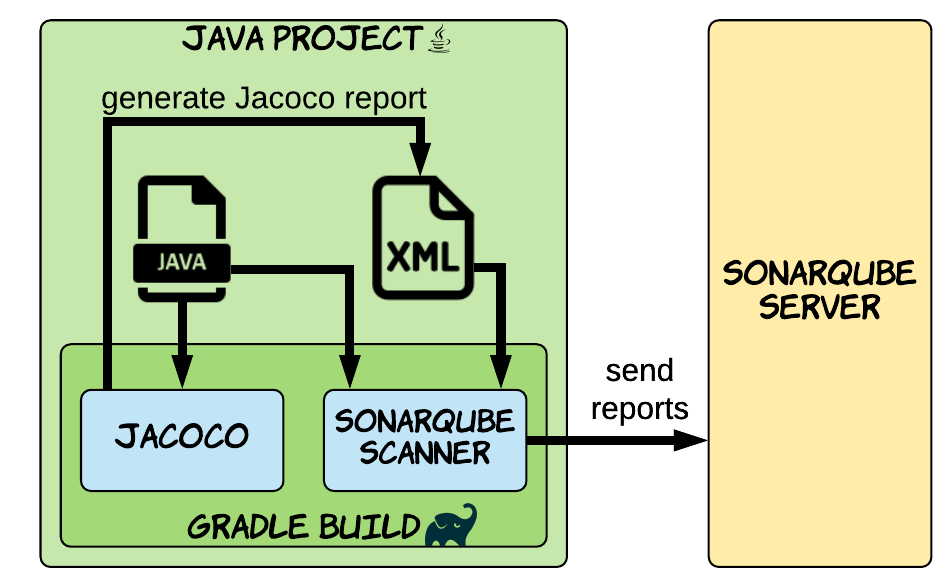
Generating code coverage data based on unit tests is straightforward in Gradle thanks to the jacoco plugin. The data can then be published to the static analysis tool SonarQube via the sonarqube plugin.

If you haven't tried out this approach yet, then I suggest first reading How to Measure Code Coverage Using SonarQube and Jacoco which explains the step-by-step process.
If you're in a hurry, here's how to configure the Gradle build.gradle build script to integrate with Jacoco and SonarQube for unit tests only.
plugins {
    id 'java'
    id 'jacoco'
    id 'org.sonarqube' version '3.3'
}

jacocoTestReport {
    reports {
        xml.required = true
    }
    dependsOn test
}

sonarqube {
    properties {
        property 'sonar.host.url', 'http://localhost:9000'
    }
}

tasks.named('sonarqube').configure {
    dependsOn jacocoTestReport
}

// repositories, dependencies, etc.
Here are the highlights:
- apply jacoco and org.sonarqube plugins
- configure jacoco plugin to produce XML reports, required by SonarQube
- configure org.sonarqube plugin to connect to a locally running SonarQube instance
- generate Jacoco report before sending data to SonarQube
With this in place, we simply run ./gradlew sonarqube to send code coverage data to the SonarQube server.

Viewing code coverage data in SonarQube
But if it's so easy to generate a code coverage metric for unit tests, how can we include integration tests too?
To understand how, let's first explore how integration testing works in Gradle.
Integration testing in Gradle
Creating a separate integration test suite is very simple since Gradle 7.3, thanks to the JVM Test Suite plugin.
The plugin is applied automatically by the java plugin, and helps setup your project so your integration tests can:
-
live in a separate source directory from your unit tests
-
have their own task to run independently from unit tests
-
have their own dependencies
The plugin can generate any type of test suite you like, but here's how you configure it for integration tests.
testing {
    suites {
        integrationTest(JvmTestSuite) {
            dependencies {
                implementation project
            }
        }
    }
}
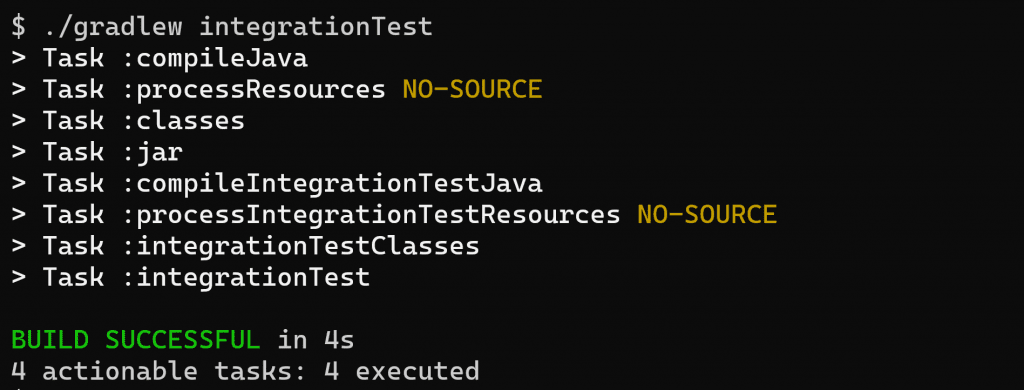
Now when we run ./gradlew integrationTest Gradle executes any tests in src/integrationTest/java.

This will pass or fail the build based on the outcome of the tests, just like when you run unit tests with ./gradlew test.
So now we know how to run integration tests, let's get into the nitty gritty of how to generate and pubilsh code coverage metrics for them.
Execution data for integration tests
Thankfully a big piece of the puzzle is already solved for us simply by including the java and jacoco plugins. With this plugin combo Gradle automatically enriches any task of type Test to also produce Jacoco code coverage execution data.
To see this in action we'll use this sample project on GitHub which has:
-
a class
MathServicewith aMathServiceTestunit test in src/test/java -
a class
Appliciationwith anApplicationTestintegration test in src/integrationTest/java
The sample project applies java and jacoco plugins, so when we run ./gradlew integrationTest Gradle produces an integrationTest.exec file.

This is the Jacoco code coverage execution data in raw binary format. Running ./gradlew test produces a similar file at build/jacoco/test.exec.
But this binary file is no good for SonarQube, which prefers muching data in XML format. 😋
Generate a combined XML test report
The main Gradle task that the jacoco plugin registers is jacocoTestReport. This by default produces an HTML report, but can be configured to also generate an XML report.
jacocoTestReport {
    reports {
        xml.required = true
    }
    dependsOn test
}
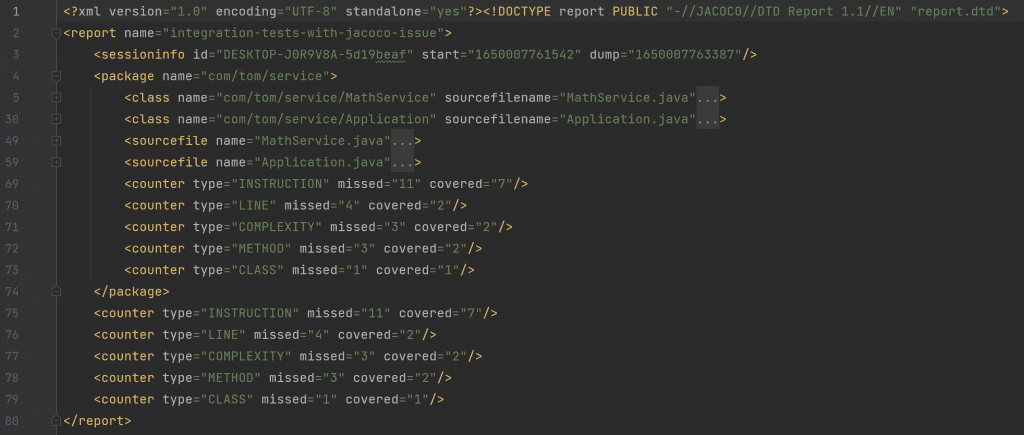
With this in place, when we run ./gradlew jacocoTestReport an XML report is produced at build/reports/jacoco/test/jacocoTestReport.xml.
The XML file is a bit of a beast, with detailed code coverage data. But here's how a minified version looks.

Right now the snippet below shows us that the main method of Application.java has not been covered by tests (covered="0").
            <method name="main" desc="(\[Ljava/lang/String;)V" line="5">
                <counter type="INSTRUCTION" missed="4" covered="0"/>
                <counter type="LINE" missed="2" covered="0"/>
                <counter type="COMPLEXITY" missed="1" covered="0"/>
                <counter type="METHOD" missed="1" covered="0"/>
            </method>
Why? Simply that the generated XML report by default only takes into account test.exec and not integrationTest.exec.
So let's combine the .exec files into a single XML report with a surprisingly simple change to the build script.
jacocoTestReport {
    executionData integrationTest
    reports {
        xml.required = true
    }
    dependsOn test, integrationTest
}- call the
executionDatamethod, passing it the integrationTest task. Gradle then knows to use the integrationTest.exec file generated by that task and include it in the Jacoco XML report. - add a task dependency on test & integrationTest to ensure execution data is already generated
Now when we run ./gradlew jacocoTestReport the report says that Application.main is covered by tests (covered="4" etc.). Neat!
            <method name="main" desc="(\[Ljava/lang/String;)V" line="5">
                <counter type="INSTRUCTION" missed="0" covered="4"/>
                <counter type="LINE" missed="0" covered="2"/>
                <counter type="COMPLEXITY" missed="0" covered="1"/>
                <counter type="METHOD" missed="0" covered="1"/>
            </method>
Send coverage data to SonarQube
Let's send the Jacoco code coverage data off to SonarQube. We'll start the SonarQube server with docker-compose up, which uses the docker-compose.yml file from the sample project.
Since the sample project has the org.sonarqube plugin applied, all we have to do now is run ./gradlew sonarqube to send the test coverage data to SonarQube.
Viewing the report in a locally running SonarQube shows us the code coverage data.

-
MathServicehas 100% coverage (from our unit test) -
Applicationhas 66.7% coverage (from our integration test)
Final thoughts
As you've seen, getting Gradle to publish integration test code coverage data to SonarQube is just a case of configuring the jacocoTestReport task to include the integrationTest.exec execution data. You may like to include other suites of tests too (e.g. end2end), depending on your use case.
Lack of Gradle knowledge slowing you down?
A broken build is easy enough to fix. But a misconfigured build is the silent time killer that costs hours every week.
Slow builds. Slow tests. Slow development.
But the official Gradle docs are confusing. Most developers never properly configure their projects—and as codebases grow, builds become bottlenecks.

This guide fixes that. It's a step-by-step walkthrough for Java developers who want to master Gradle fast.
- Unlock the mysteries of the build script.
- Speed up your workflow.
- Make development fun again.