Monitoring A Spring Boot Application, Part 3: Rules & Alerting

When your application is exposing useful metrics about how it's behaving, there's no fun in constantly monitoring it for problems. Instead, you need to configure rules and alerts for when those rules are broken. In this article you'll discover how to set up such a simple email alerting system for your Spring Boot application.
This is part 3 in the series about monitoring a Spring Boot application. If you're not yet familiar with Prometheus, be sure to check out part 2 where we discuss it in detail.
1. Overview
Prometheus is configured to scrape metrics from your application. As seen in part 2, it is straightforward to query those metrics to find out exactly what's going on in our application.
To know when there's a problem, we'll use these queries to configure rules, which will be in either a broken or non-broken state. When a rule is broken, an alert will be triggered via another service we'll setup called AlertManager.
In AlertManager you configure how you want to deal with an alert. Some alerts may be sufficient to send by email, but others may require a phone call to wake someone up in the middle of the night to sort things out.
2. Rules
Here are some example rules we might configure:
- is my server not running?
- is my rate of requests hitting my server too high?
- is my server's memory usage greater than 95%
A rule has a binary true or false answer. Once a rule is broken, an alert is raised.
Rule syntax
In part 2, we saw that you can query the rate of requests for a particular endpoint of our Spring Boot application:
rate(http_server_requests_seconds_count{uri="/doit"}[5m])
This particular query returns us the per second rate of requests to the doit endpoint, averaged out over 5 minutes.
A rule is simply a metric, with a condition. If we wanted to create an alert for when our application has a request rate greater than 0, the rule would be:
rate(http_server_requests_seconds_count{uri="/doit"}[5m]) > 0
Prometheus rule configuration
In Prometheus language a rule which raises an alert is called an alerting rule. It's defined along with some other information:
groups:
  - name: default
    rules:
      - alert: RequestRate
        expr:  rate(http_server_requests_seconds_count{uri="/doit"}[5m]) > 0
        for: 1m
        labels:
          severity: high
        annotations:
summary: Application receiving too many requests- alert - a name for the raised alert when the rule is broken
- expr - the actual rule definition, as already described
- for - how long the rule needs to be broken for to raise an alert. In our case, if the request rate remains greater than 0 for 1 minute, an alert will be raised
- labels - extra information that can be attached to the alert, e.g. severity
- annotations - extra descriptions that can be attached to the alert, e.g. summary
Info: this rule of request rate greater than 0 isn't something you would typically setup for your application. We'll use it as an example as it will be easy for us to break the rule by making a few requests. In a real-life scenario you may instead want to define a rule for if the request rate is unexpectedly high.
3. Alerts
When a rule is broken, if Prometheus has an AlertManager instance configured, it will send all the alert details over.
AlertManager is a separate service, in which you can configure exactly how alerts should be handled and where they should be sent. It that has 2 main concepts which are worth understanding:
- receivers - the channels through which alerts may be surfaced e.g. email, Slack, webhooks
- routes - based on an alert's labels, the alert will follow a particular route and surface through a particular receiver. For example, we may have an application label on all alerts which is used to route through to the email address of the team responsible for that particular application.
These are the essentials which you'll need to grasp to setup a basic alerting system. AlertManager does offer more advanced functionality, such as grouping alerts, silencing alerts via it's UI, and inhibit rules to mute alerts.
4. Working Example
We'll pick up from where we let off in part 2, and extend our Spring Boot Docker compose monitoring solution to include:
- a basic AlertManager configuration to email us any alerts it receives
- an AlertManager container
- a basic Prometheus rule configuration
- a Prometheus configuration to push to AlertManager
For this example, we'll be setting up an alert via email through a Gmail account, so make sure you have one of these setup over at gmail.com.
Gmail setup
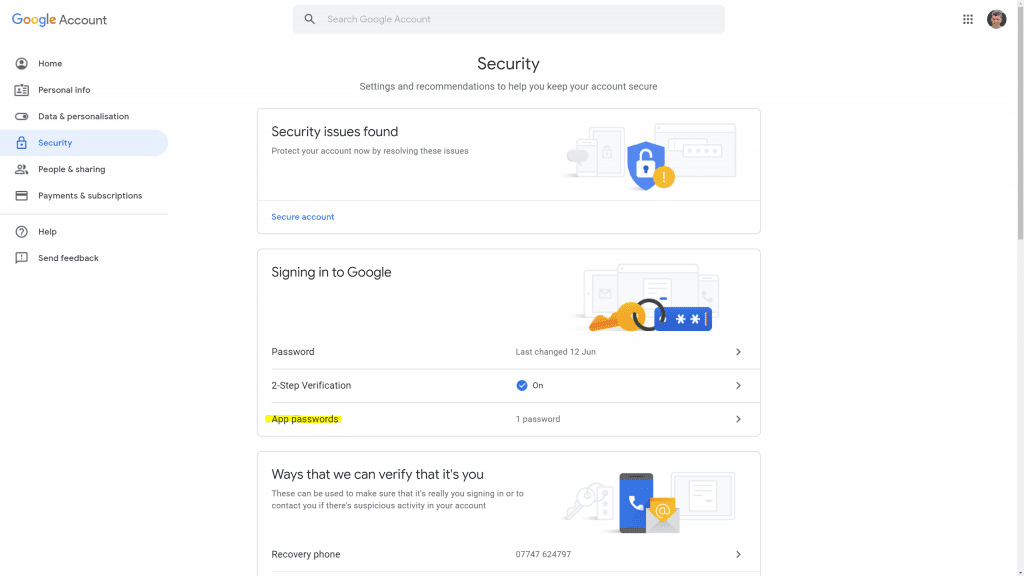
We'll configure AlertManager with a Gmail account, but in order to do this we'll need to generate something called an app password within Gmail. Gmail has a full guide on this, but essentially you need to go the security settings of your Google Account and click on App Passwords under Signing into Google:

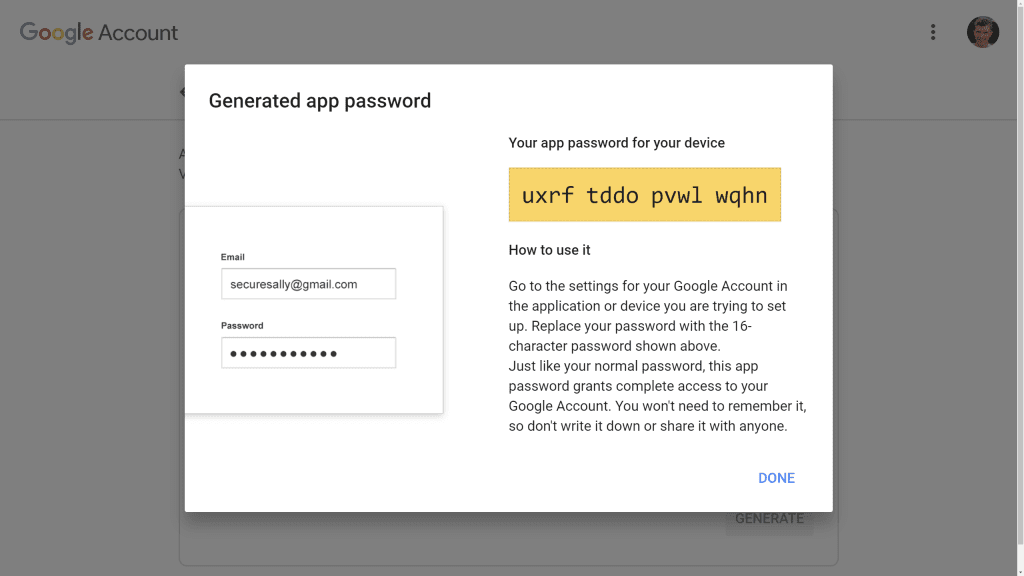
On the next page you can create a new app password by selecting app Mail and device Other (enter AlertManager in the text field). You'll then get a new app password for use in the AlertManager configuration:

AlertManager configuration
Create a file alertmanager.yml and add the following configuration, substituting in your Gmail email address and app password:
route:
  receiver: emailer
receivers:
- name: emailer
  email_configs:
  - to: <gmail-email-address>
    from:  <gmail-email-address>
    smarthost: smtp.gmail.com:587
    auth_username: <gmail-email-address>
    auth_identity: <gmail-email-address>
    auth_password: <gmail-app-password>
Info: as described in the earlier section, we're setting up a route and a receiver. The route is the most basic possible, and tells AlertManager to use the same emailer receiver whatever the alert. The receiver is the email type, and contains all the configuration needed to connect with our email account.
AlertManager container
To add an AlertManager container, let's extend docker-compose.yml by adding the section in bold below:
version: "3"
 services:
   application:
     image: tkgregory/sample-metrics-application:latest
     ports:
       - 8080:8080
     depends_on:
       - prometheus
   prometheus:
     image: prom/prometheus:latest
     volumes:
       - ./prometheus.yml:/etc/prometheus/prometheus.yml
       - ./rules.yml:/etc/prometheus/rules.yml
     ports:
       - 9090:9090
  alertmanager:
    image: prom/alertmanager:latest
    ports:
      - 9093:9093
    volumes:
      - ./alertmanager.yml:/etc/alertmanager/alertmanager.yml
Info: the additional configuration tells Docker to start AlertManager on port 9093. We're mounting the alertmanager.yml file inside the container at the default AlertManager configuration file location.
Run docker-compose up and you'll see you have an instance of AlertManager running on http://localhost:9093.

AlertManager: not much to look at, but it does the job
Prometheus rule configuration
To configure a rule in Prometheus, you add the rule to what's called a rule file. Create a rule file rules.yml containing the same rule configuration described earlier:
groups:
  - name: default
    rules:
      - alert: RequestRate
        expr:  rate(http_server_requests_seconds_count{uri="/doit"}[5m]) > 0
        for: 1m
        labels:
          severity: high
        annotations:
          summary: Application stopped receiving requests
The rule file then needs to be referenced in the main prometheus.yml configuration, by adding the section in bold below:
scrape_configs:
  - job_name: 'application'
    metrics_path: '/actuator/prometheus'
    static_configs:
      - targets: ['application:8080']
rule_files:
  - 'rules.yml'
Prometheus AlertManager configuration
We also need to update prometheus.yml with details about how Prometheus can connect to our AlertManager container. Once again, add the bold text below:
scrape_configs:
  - job_name: 'application'
    metrics_path: '/actuator/prometheus'
    static_configs:
      - targets: ['application:8080']
rule_files:
  - rules.yml
alerting:
   alertmanagers:
     - static_configs:
         - targets:
             - alertmanager:9093
Info: here we're telling Prometheus to connect to an AlertManager instance we have running on alertmanager:9093. Remember that Docker will automatically expose the container name alertmanager as a host on the network.
Bringing it all together
Now everything is configured, run docker-compose up again.
Since the alert will be triggered when the rate of requests to http://localhost:8080/doit goes above 0, hit that URL a few times. Wait 15 seconds and do the same again.
Info: the Prometheus rate function relies on the metric value from 2 separate scrapes. That's why we have to hit /doit twice, at least 15 seconds apart (the default scrape interval). Once is to initialise the metric and once again to increment it.
You can keep an eye on http://localhost:9090/alerts to see the status of the RequestRate rule. You may need to wait up to 5 minutes for this rule to change status. It will first go yellow, to indicate it's in the PENDING status. After the for interval defined in rules.yml has passed (in our case 1 minute) it will go red, to indicate the FIRING status.

When the rule is in the FIRING status, Prometheus will contact AlertManager to generate an alert. AlertManager will decide what to do with the alert, in our case sending an email.
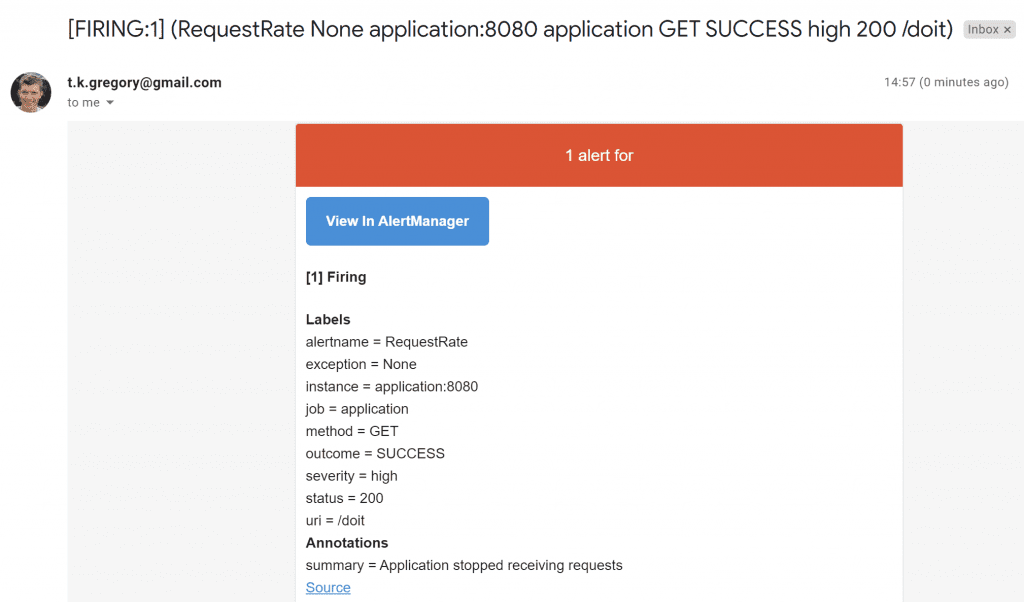
You'll get an email in your inbox looking something like this:

After some time, as long as no further requests are received to /doit, the rule will go green again. Panic over!
If you wanted to receive an email when this happens, you'd have to update the alertmanager.yml configuration by setting send_resolved: true under email_configs.
5. Conclusion
Combining Prometheus and AlertManager allows us to easily configure rules against metrics, and to alert us of important application scenarios that we need to know about.
We've seen that it's easy to configure AlertManager to send alert emails to a Gmail account. There are many more receivers available, so head on over to the AlertManager website to learn more.
If you want to learn how to visualise metric data in an easy to understand way, enabling you to make good decisions quickly, then check out the next and final article in this series.
6. Resources
- Prometheus documentation and Docker image
- AlertManager documentation and Docker image
- Sample metrics application Docker image
If you prefer to learn in video format, check out this accompanying video to this post on my YouTube channel.
If this is a problem you're dealing with in your own team, you can see how I approach software delivery in practice.