When to use an AWS S3 VPC endpoint

What is an S3 VPC endpoint? To understand what an S3 VPC endpoint is, we first need to know what problem it solves. Imagine we want to get access to S3 from an AWS resource. In the example below, we have an EC2 instance that needs to copy a file from an S3 bucket: This works, because: the EC2 instance is in a public subnet, so has access to the internet therefore the EC2 instance can reach the AWS S3 URL to copy the file from the S3 bucket Public subnets A public subnet is simply one that has a route to the internet....
Published 10 Apr 2020 · 8 min read · Tom Gregory

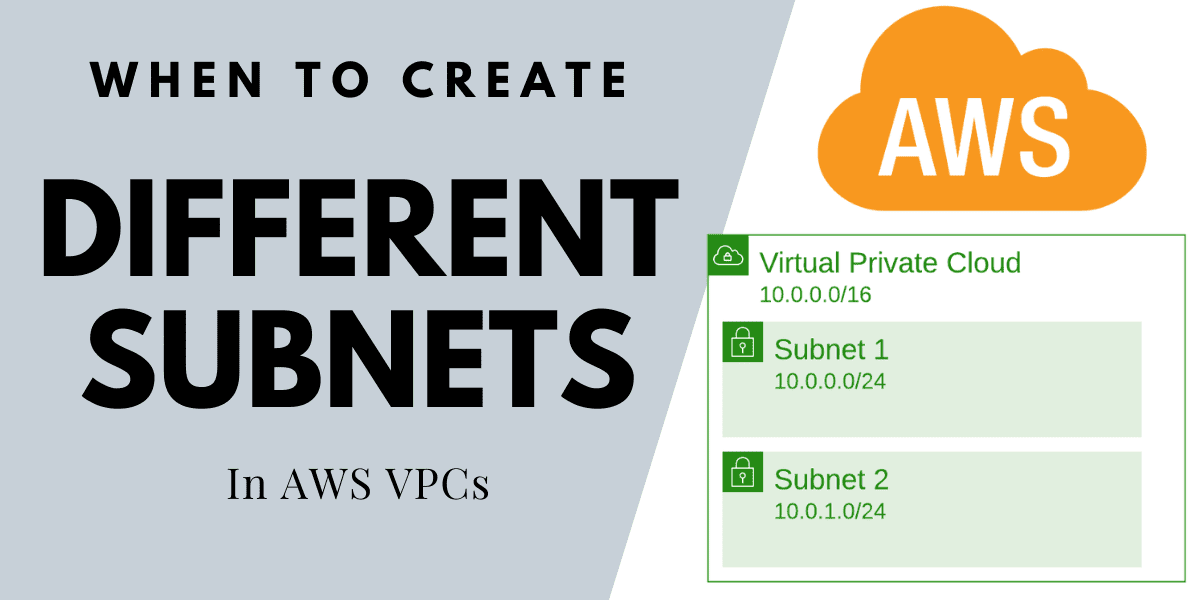
When to create different subnets in AWS VPCs

Configuring subnets and VPCs can be confusing when you’re setting up AWS infrastructure. There’s plenty of documentation about what subnets are, and how to create them, but not necessarily when and why you’d create them. In this article you’ll learn why you’d want to create multiple subnets in the first place. First off though, here’s a quick recap of all the network related infrastructure that lives in a VPC. If you’re familiar with this, just skip to the main section of the article....

Published 24 Jan 2020 · 6 min read · Tom Gregory

Recursive AWS Lambda Functions in Node.js JavaScript

AWS Lambda functions are a great way to execute short-running processes without worrying about what hardware they’re going to run on. Sometimes though, we have a requirement to execute a longer-lived process, but unfortunately AWS imposes a 15 minute execution limit. Fear not though, because in this article you’ll learn how to write recursive Node.js JavaScript Lambda functions which call themselves, bypassing the execution time limit. 1. Overview In October 2018 AWS increased the Lambda execution time limit to 15 minutes:...

Published 3 Jan 2020 · 10 min read · Tom Gregory

The 4 Types Of Prometheus Metrics

Prometheus is an excellent tool for gathering metrics from your application so that you can better understand how it’s behaving. When deciding how to publish metrics, you’ll have 4 types of metrics to choose from. In this article you’ll discover what are the different types of Prometheus metrics, how to decide which one is right for a specific scenario, and how to query them. Overview Prometheus is a standalone service which scrapes metrics from whatever applications you’ve configured....

Published 2 Dec 2019 · 12 min read · Tom Gregory

Monitoring A Spring Boot Application, Part 4: Visualisation & Graphing

Once you’ve setup metrics for your application, and can query them and alert from them, when something goes wrong you need somewhere to go to quickly get a visual overview of what’s happening. In this article, you’ll discover how to setup a basic dashboard with Grafana, showing useful graphs to summarise the current state of a Spring Boot application. This is part 4, the final part of this series on monitoring a Spring Boot application....

Published 8 Nov 2019 · 7 min read · Tom Gregory

Monitoring A Spring Boot Application, Part 3: Rules & Alerting

When your application is exposing useful metrics about how it’s behaving, there’s no fun in constantly monitoring it for problems. Instead, you need to configure rules and alerts for when those rules are broken. In this article you’ll discover how to set up such a simple email alerting system for your Spring Boot application. This is part 3 in the series about monitoring a Spring Boot application. If you’re not yet familiar with Prometheus, be sure to check out part 2 where we discuss it in detail....

Published 1 Nov 2019 · 8 min read · Tom Gregory

Monitoring A Spring Boot Application, Part 2: Prometheus

As part of a monitoring solution you’ll need a service to pull metrics from your applications, store them, and provide an easy way to query them. Prometheus is a tool which allows you to do all three. In this article you’ll learn all about Prometheus, how to set it up, point it to your application, and query it. If you want to see the high level overview of a complete monitoring solution for Spring Boot, check out last week’s blog post....

Published 25 Oct 2019 · 6 min read · Tom Gregory

Monitoring A Spring Boot Application, Part 1: Fundamentals

Being able to monitor a production application is fundamental in order to be alerted to any issues and quickly find a solution to problems. Many people seem to put in monitoring as an afterthought, or not at all. In this multi-part blog series you’ll discover how to setup monitoring, graphing, and alerting for a Spring Boot application. In part 1, you’ll get a birds eye view of the requirements involved in a complete monitoring solution....

Published 17 Oct 2019 · 6 min read · Tom Gregory

Creating AWS CloudFormation Resources With The Service Role

1. Introduction CloudFormation is a useful tool when working with AWS to define your infrastructure as code, or at least a YAML or JSON template. These templates allow us to make almost any change imaginable within the AWS ecosystem. In this article we’ll take a look at how to practice the principle of least privilege with CloudFormation, with a working example making use of the CloudFormation service role. This will allow the CloudFormation stack to make changes by assuming that role, completely separately from the user or role who initiates the change in the first place....

Published 10 Oct 2019 · 8 min read · Tom Gregory