SonarQube branch analysis

SonarQube helps us improve code quality using static analysis techniques. You can even add quality gates to fail your CI pipeline if the master branch doesn't meet your requirements. Why not also apply the same technique to feature branches?
In this article you'll learn how to setup SonarQube branch analysis to check the quality of both master and feature branches, finding potential issues even earlier in the development lifecycle.
SonarQube branch analysis version compatibility
SonarQube branch analysis is only available for specific editions of SonarQube.
| Edition | Cost | Description | Includes branch analysis? | Supported Docker SonarQube versions |
|---|---|---|---|---|
| Community | Free | Includes most important code quality features | ❌ | 7.9 (LTS), 8.2+ |
| Developer | Paid | Same as Community + additional features | ✅ | 8.2+ |
| Enterprise & Data Centre | Paid | Same as Developer + additional features like high availability | ✅ | 8.7+ |
In summary, if you want to use branch analysis you need to get out your wallet and pay for it. The Developer edition currently costs $120/year for up to 100,000 lines of code. For other options and to apply for a free trial, check out Plans & Pricing.
Enabling branch analysis
Enabling branch analysis is as simple as setting an additional property to be passed to the SonarQube server during analysis.
sonar.branch.name
Unsurprisingly, the parameter's value should be name of the branch for which you're doing analysis e.g. master, my-awesome-feature.
Configuration in a Gradle project
As already discussed in How To Measure Code Coverage Using SonarQube and Jacoco, we can get Gradle to do SonarQube analysis using the sonarqube plugin. To add branch analysis we must add the sonar.branch.name property to the plugin configuration.
sonarqube {
    properties {
        property 'sonar.host.url', 'http://localhost:9000'
        property 'sonar.branch.name', gitBranch()
    }
}

String gitBranch() {
    String branch = ""
    Process proc = "git rev-parse --abbrev-ref HEAD".execute()
    proc.in.eachLine { line -> branch = line }
    proc.err.eachLine { line -> println line }
    proc.waitFor()
    return branch
}
Since the plugin doesn't do anything clever to derive the branch name, we can do that ourselves using a custom gitBranch function. Now when you run ./gradlew sonarqube the sonar.branch.name will get sent through to the SonarQube server during analysis.
Another option, if you really wanted to, is to pass the property on the command line when you execute your Gradle task.
./gradlew sonarqube -Dsonar.branch.name=<your-branch-name>
Configuration using SonarScanner
If you're using the sonar-scanner tool directly you have these options:
- include
sonar.branch.namein your sonar-project.properties file - pass the parameter on the command line e.g.
sonar-scanner -Dsonar.branch.name=<your-branch-name>
How do branches appear on the SonarQube server?
Nothing too exciting here, but you get a handy dropdown showing your available branches.

You can also search for a specific branch. Once you select a branch, you have all the SonarQube features you're used to, such as viewing the list of issues and browsing problematic code. 👌
A working example of branch analysis
Let's run through a quick example of setting up SonarQube branch analysis for a project with two branches:
- a
masterbranch with perfect code - a
bad-codebranch with some code smells
We'll use an existing Gradle project, and extend it to enable branch analysis as described above.
We'll deploy a SonarQube server in Docker, configure a license key which you can get from the free trial or buy, then run the analysis on both branches and see how it looks on the server.
Deploy a SonarQube instance
Assuming you already have Docker installed, just run the following:
docker run -d --rm -p 9000:9000 --name sonarqube sonarqube:developer
This runs a Docker container of the SonarQube Developer edition image, configured to:
- run on port
9000 - run in the background (
-d) - get cleaned up automatically when you stop the container (
--rm) - be named sonarqube for easy access
SonarQube will take a minute or two to start. Tail the logs with docker logs -f sonarqube.
2021.03.28 16:16:04 INFO  ce[][o.s.c.c.ComputeEngineContainerImpl] Running Developer edition
2021.03.28 16:16:04 INFO  ce[][o.s.ce.app.CeServer] Compute Engine is operational
2021.03.28 16:16:04 INFO  app[][o.s.a.SchedulerImpl] Process[ce] is up
2021.03.28 16:16:04 INFO  app[][o.s.a.SchedulerImpl] SonarQube is up
When you see the above text you can access SonarQube at http://localhost:9000. The default username/password are admin/admin.
Configure SonarQube
Once you've logged in and setup a new password, you'll get this notification since we're using the Developer edition of SonarQube.

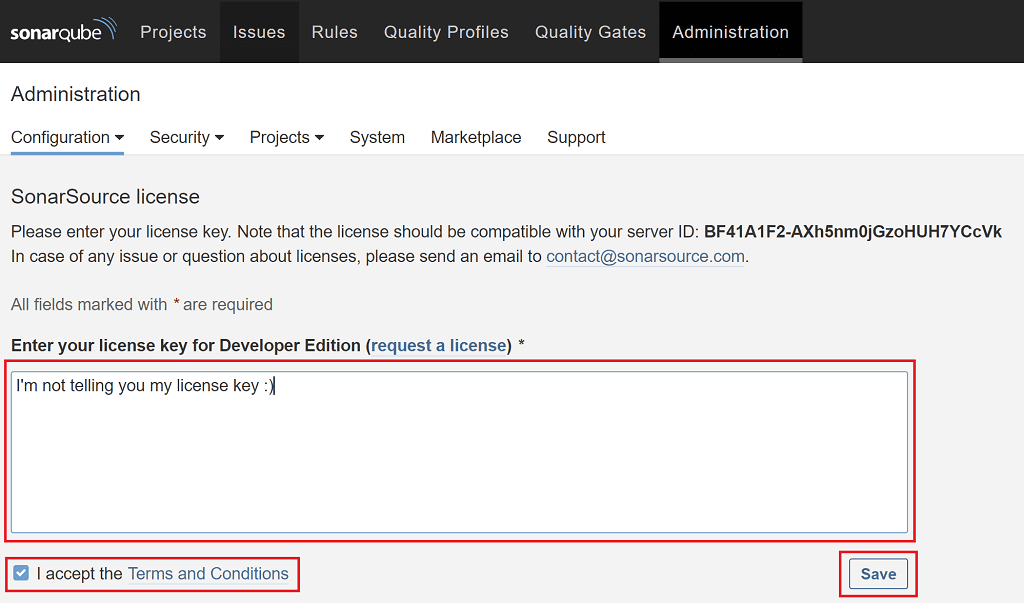
Select Go to License page (or go to Administration > Configuration > License Manager), enter your license key, then select Save.

One last thing to setup is to create a security token to authenticate the analysis request to the SonarQube server.
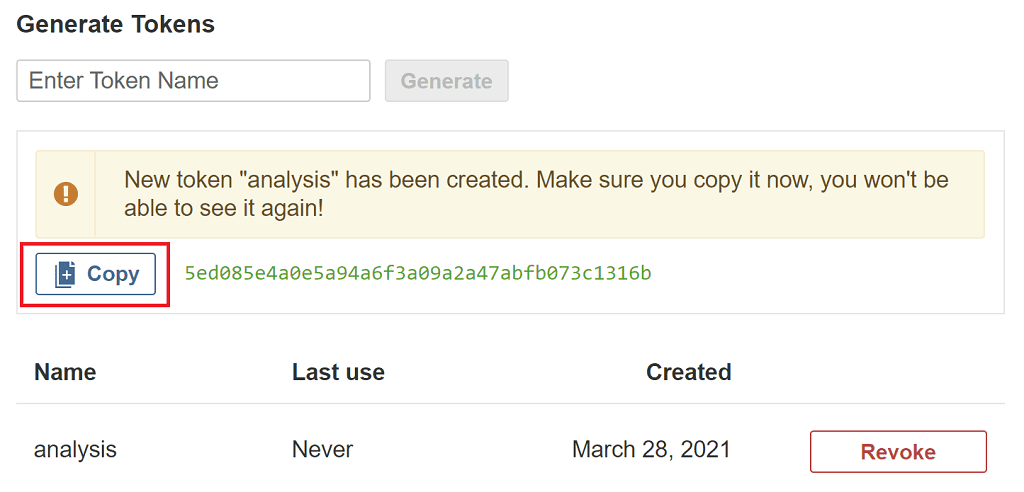
Select the A in the top right-hand side of the page, select My account, select Security, then enter a token name of analysis and click Generate.
Copy the key and keep it safe somewhere as you'll need it shortly.

Analyse branches
We're going to use the sonarqube-jacoco-code-coverage GitHub repository which is already setup with the two branches mentioned earlier. Clone the repository locally:
git clone https://github.com/tkgregory/sonarqube-jacoco-code-coverage.git
Now go ahead and edit the build.gradle file and make the following changes which you can copy from the earlier section:
- add the
sonar.branch.nameproperty to the SonarQube plugin configuration - add the
gitBranchfunction
Let's now analyse the master branch by simply running:
./gradlew sonarqube -Dsonar.login=<security-token>
Remember to paste in the security token you copied earlier.
Now switch to the bad-code branch with git checkout bad-code and run the same Gradle command again.
In the SonarQube UI select Projects and you'll now see an entry for the sonarqube-jacoco-code-coverage project.

Select the project name, then at the top select master to switch between the two branches. To prove we're seeing different analysis results for each branch view the Code Smells section for both the master and bad-code branches.
On the master branch you can see we've got no code smells.

Whereas on the bad-code branch we have 2 code smells and a maintainability rating of B! 😲

OK, well I'm sure we've all seen worse code before. At least with the branch analysis we can make sure it doesn't get into master.
Final thoughts
You've seen that it's straightforward to setup branch analysis for a project using the paid version of SonarQube and the sonar.branch.name property. This should help you monitor the quality of your feature branches, and avoid poor quality code making it into master.
There are a few other points you can read about in the official docs, including New Code settings for branches and auto-cleanup of inactive branches.
Lack of Gradle knowledge slowing you down?
A broken build is easy enough to fix. But a misconfigured build is the silent time killer that costs hours every week.
Slow builds. Slow tests. Slow development.
But the official Gradle docs are confusing. Most developers never properly configure their projects—and as codebases grow, builds become bottlenecks.

This guide fixes that. It's a step-by-step walkthrough for Java developers who want to master Gradle fast.
- Unlock the mysteries of the build script.
- Speed up your workflow.
- Make development fun again.
If this is a problem you're dealing with in your own team, you can see how I approach software delivery in practice.