Spring Boot Default Metrics

Spring Boot 2's actuator module provides monitoring and management capabilities for your application, and includes the Micrometer metrics collection facility. Micrometer comes preconfigured with many useful default metrics, and also includes the ability for you to configure your own.
In this article we'll run through the most important default metrics provided in Spring Boot, and how you can use them to more effectively highlight problems within your application.
Spring Boot Actuator and Micrometer overview
The Spring Boot Actuator exposes many different monitoring and management endpoints over HTTP and JMX. It includes the all-important metrics capability, by integrating with the Micrometer application monitoring framework. Micrometer is a vendor-neutral metrics facade, meaning that metrics can be collected in one common way, but exposed in the format required by many different monitoring systems.
Think SLF4J, but for metrics.
(from the Micrometer home page)
Popular monitoring frameworks supported include Graphite, Prometheus, and StatsD. In this article we'll be focusing on Prometheus, which is a standalone service which intermittently pulls metrics from your application.

Adding actuator metrics to your Spring Boot application
Follow these steps to configure your Spring Boot application to publish metrics in the Prometheus format.
Include additional dependencies
To include the Spring Boot Starter Actuator module, add the following to your list of Gradle dependencies:
implementation 'org.springframework.boot:spring-boot-starter-actuator'Here's the equivalent in Maven:
<dependency>
    <groupId>org.springframework.boot</groupId>
    <artifactId>spring-boot-starter-actuator</artifactId>
</dependency>
We're also going to add the Micrometer Registry Prometheus module, so we can scrape metrics from the application in the Prometheus format:
In Gradle:
implementation 'io.micrometer:micrometer-registry-prometheus:1.5.1'In Maven:
<dependency>
    <groupId>io.micrometer</groupId>
    <artifactId>micrometer-registry-prometheus</artifactId>
    <version>1.5.1</version>
</dependency>
Enable metrics through configuration
By default almost all the Spring Boot Actuator HTTP endpoints are disabled, but can be enabled through configuration. Add the following line to your application.properties file in the src/main/resources folder of your project:
management.endpoints.web.exposure.include=metrics,prometheus
The actuator module has many endpoints that can be enabled, but this configuration enables just two:
-
the
/actuator/metricsendpoint which provides a JSON API for navigating your metrics and viewing their values -
the
/actuator/prometheusendpoint which returns the metrics in the custom format required for ingesting into Prometheus. This is the format we'll be talking about in rest of this article.
1. Spring MVC metrics
For any web application the default Spring MVC metrics provide an excellent starting point for monitoring inbound HTTP traffic. Whether you need to keep track of errors, traffic volume, or request latency, these metrics have you covered.
Prometheus metric types We'll be mentioning the different metric types supported by Prometheus in the following sections, so if you're not familiar with them check out The 4 Types Of Prometheus Metrics article on this subject.
Inbound HTTP request duration
For each endpoint that your Spring Boot application exposes we get the http_server_requests_seconds summary metric which gives us information about the number of requests and request duration. It comprises two metrics exposed on the /actuator/prometheus endpoint:
# TYPE http_server_requests_seconds summary
http_server_requests_seconds_count{exception="None",method="GET",outcome="SUCCESS",status="200",uri="/doit",} 20.0
http_server_requests_seconds_sum{exception="None",method="GET",outcome="SUCCESS",status="200",uri="/doit",} 0.132131598-
http_server_requests_seconds_count is the total number of requests your application received at this endpoint
-
http_server_requests_seconds_sum is the sum of the duration of every request your application received at this endpoint
These metrics also contain the following tags:
| Tag | Description | Examples |
|---|---|---|
| exception | The class name of any exception that was thrown | None, NullPointerException |
| method | The HTTP request method | GET, POST, PUT, PATCH, etc. |
| outcome | A String description of the HTTP response status | SUCCESS, SERVER_ERROR |
| status | The HTTP response status code | 200, 500, etc. |
| uri | The request URI | /doit |
Tags recap Tags are useful for measuring variants of metrics. For example, with http_server_requests_seconds_count you can measure the number of requests to a specific URI.
If your application starts returning different error response statuses then these will be separated out into metrics with a different status tag. You can then query these metrics together or separately.
In Prometheus we can make a simple query which will give us the average inbound request duration across all tags:
rate( http_server_requests_seconds_sum[1m]) / rate(http_server_requests_seconds_count[1m])
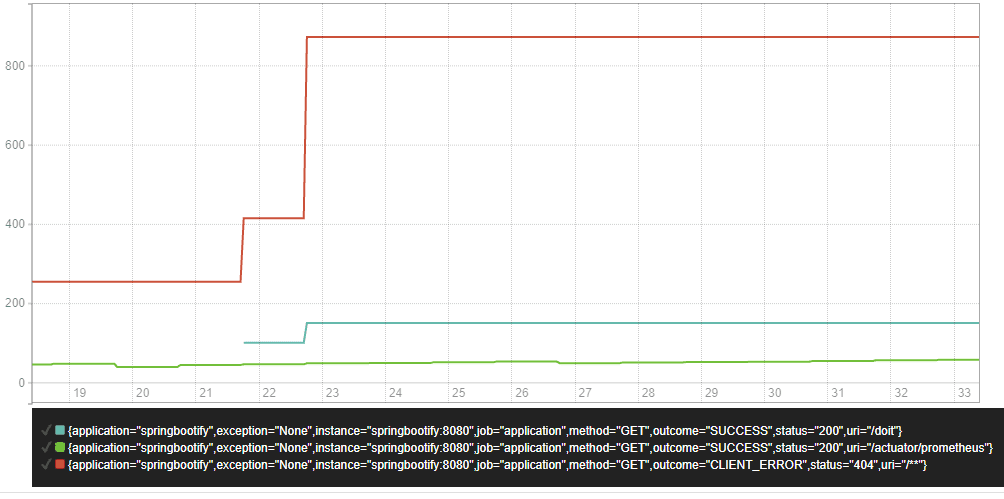
Why use rate? You may be wondering why the Prometheus query above includes the rate function Why not just divide the request count by the total request duration? 🤔 There's an explanation over on the Micrometer website:
"Representing a counter without rate normalization over some time window is rarely useful, as the representation is a function of both the rapidity with which the counter is incremented and the longevity of the service."
Inbound HTTP request quantiles & percentiles
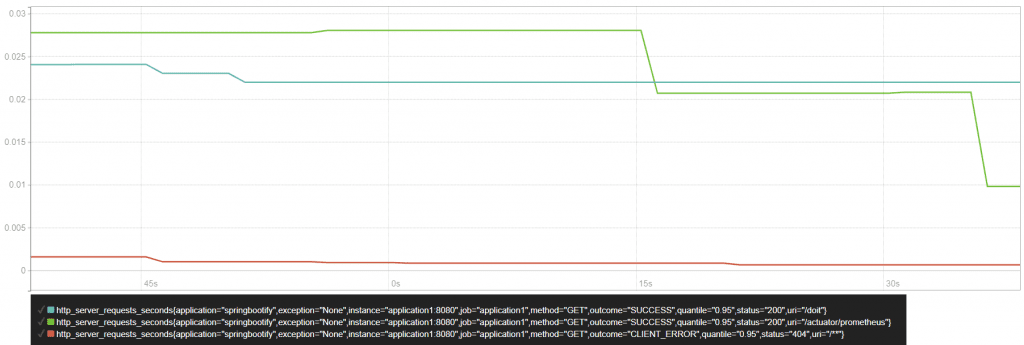
Spring MVC metrics can also calculate quantiles and percentiles, which can be useful when you want to assess how slow is the request duration of an API while ignoring the very slowest requests.
For example, the 95th percentile is the value at which 95% of the observed values are below, and 5% are above. In other words, it gives you the slowest request duration that 95% of requests are seeing.
To enable quantiles an additional configuration property needs to be added to your application.properties, substituting in whatever quantiles (not percentiles, despite the name) you're interested in:
management.metrics.web.server.request.autotime.percentiles=<comma-separated list of quantiles>
If we configure the property as 0.95 this would result in the following metric at /actuator/prometheus:
http_server_requests_seconds{exception="None",method="GET",outcome="SUCCESS",status="200",uri="/doit",quantile="0.95",} 0.023068672
The tags used with this metric are the same as above, except now we also have a quantile tag, which can be used to query the metric.
The following graph is generated in Prometheus from the http_server_requests_seconds{quantile="0.95"} query:
Inbound HTTP request maximum duration
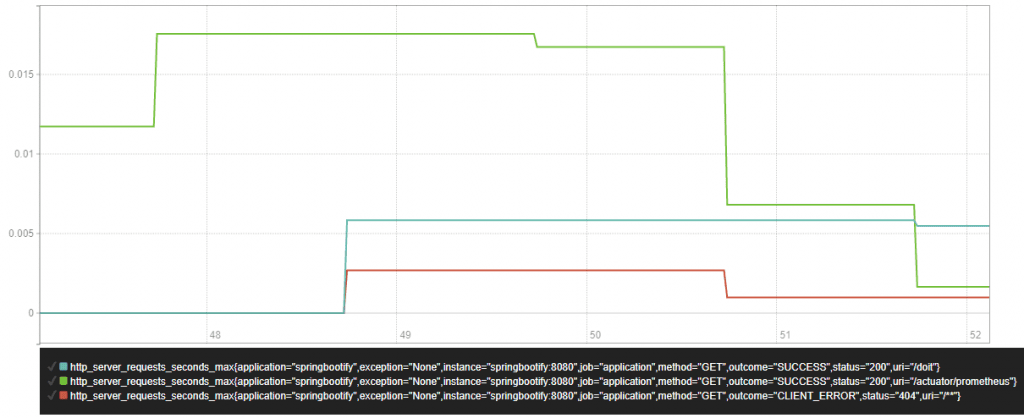
For each endpoint that your Spring Boot application exposes we get the http_server_requests_seconds_max gauge metric which gives us the maximum duration of each type of inbound HTTP request.
# HELP http_server_requests_seconds_max
# TYPE http_server_requests_seconds_max gauge
http_server_requests_seconds_max{exception="None",method="GET",outcome="SUCCESS",status="200",uri="/doit",} 0.014306- http_server_requests_seconds_max is the maximum request duration during a time window. The value resets to 0 when a new time window starts. The default time window is 2 minutes.
The tags used with this metric are the same as above.
This graph is generated in Prometheus from the plain http_server_requests_seconds_max query:
2. HTTP Client RestTemplate & WebClient outbound request metrics
If you use the RestTemplate or WebClient classes to make outbound HTTP requests then you'll benefit from similar request metrics as inbound HTTP requests. For these metrics to work, make sure to use an injected RestTemplateBuilder or WebClient.Builder class to build your HTTP client.
Outbound HTTP request duration
Each outbound endpoint gets a http_client_requests_seconds metric. It comprises two metrics exposed by the /actuator/prometheus endpoint:
# HELP http_client_requests_seconds Timer of RestTemplate operation
# TYPE http_client_requests_seconds summary
http_client_requests_seconds_count{clientName="google.com",method="GET",outcome="SUCCESS",status="200",uri="/https://google.com",} 3.0
http_client_requests_seconds_sum{clientName="google.com",method="GET",outcome="SUCCESS",status="200",uri="/https://google.com",} 0.465022459-
http_client_requests_seconds_count is the total number of requests your application made to this endpoint
-
http_client_requests_seconds_sum is the sum of the duration of every request your application made to this endpoint
These metrics also contain the following tags:
| Tag | Description |
|---|---|
| clientName | A name for the endpoint you are calling, using the host from the URI |
| exception | The class name of any exception that was thrown |
| method | The HTTP request method |
| outcome | A String description of the HTTP response status |
| status | The HTTP response status code |
| uri | The request URI |
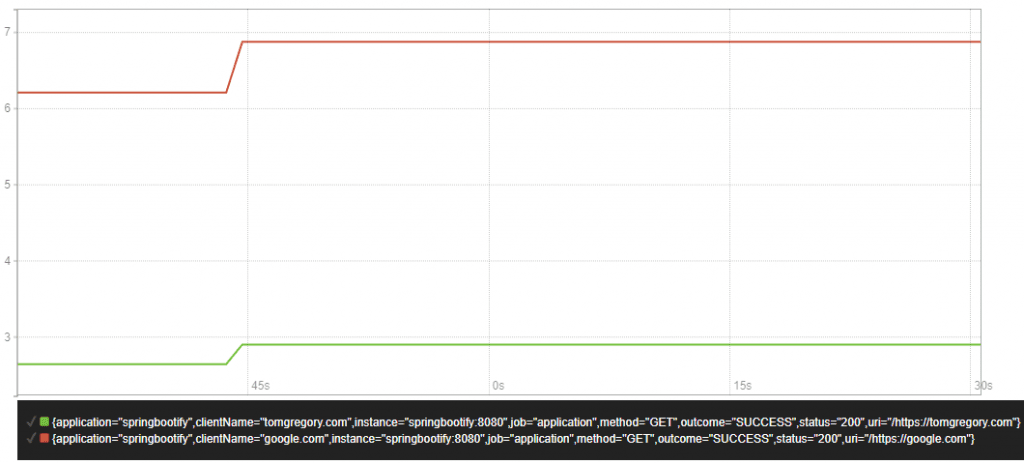
In Prometheus we can make a simple query which will give us the average outbound request duration over time:
rate(http_client_requests_seconds_sum[1m]) / rate(http_client_requests_seconds_count[1m])
Outbound HTTP request maximum duration
Each outbound endpoint gets a http_client_requests_seconds_max gauge metric, which gives us the maximum duration of each type of outbound HTTP request.
# HELP http_client_requests_seconds_max Timer of RestTemplate operation
# TYPE http_client_requests_seconds_max gauge
http_client_requests_seconds_max{clientName="google.com",method="GET",outcome="SUCCESS",status="200",uri="/https://google.com",} 0.205564498- http_client_requests_seconds_max is the maximum request duration during a time window. The value resets to 0 when a new time window starts. The default time window is 2 minutes.
The tags used with this metric are the same as above.
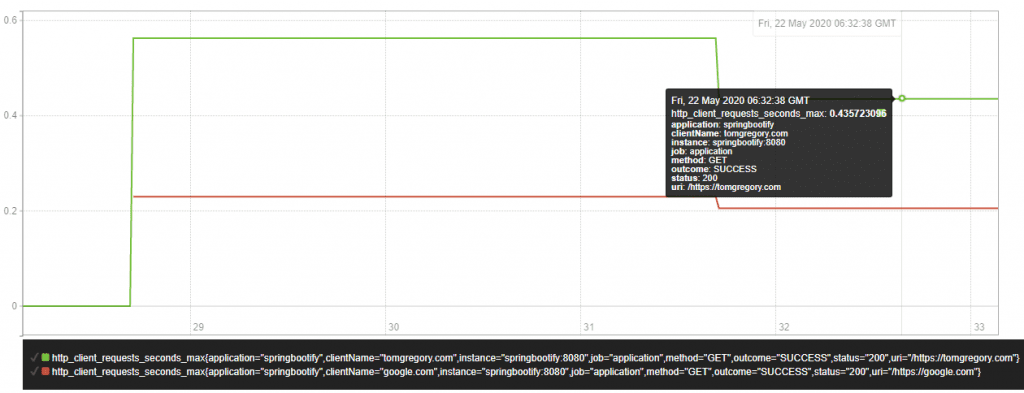
This graph is generated in Prometheus from the plain query http_client_requests_seconds_max:
3. JVM metrics
Micrometer includes three types of metrics to help monitor what's happening in the Java Virtual Machine (JVM).
JVM memory metrics
For each memory area we can see how much memory has been used with jvm_memory_used_bytes and how much memory is available with jvm_memory_max_bytes:
# HELP jvm_memory_used_bytes The amount of used memory
# TYPE jvm_memory_used_bytes gauge
jvm_memory_used_bytes{area="nonheap",id="CodeHeap 'profiled nmethods'",} 8231168.0
jvm_memory_used_bytes{area="heap",id="G1 Survivor Space",} 5242880.0
jvm_memory_used_bytes{area="heap",id="G1 Old Gen",} 1.164288E7
jvm_memory_used_bytes{area="nonheap",id="Metaspace",} 4.180964E7
jvm_memory_used_bytes{area="nonheap",id="CodeHeap 'non-nmethods'",} 1233536.0
jvm_memory_used_bytes{area="heap",id="G1 Eden Space",} 1.2582912E7
jvm_memory_used_bytes{area="nonheap",id="Compressed Class Space",} 5207416.0
jvm_memory_used_bytes{area="nonheap",id="CodeHeap 'non-profiled nmethods'",} 1590528.0
# HELP jvm_memory_max_bytes The maximum amount of memory in bytes that can be used for memory management
# TYPE jvm_memory_max_bytes gauge
jvm_memory_max_bytes{area="nonheap",id="CodeHeap 'profiled nmethods'",} 1.22912768E8
jvm_memory_max_bytes{area="heap",id="G1 Survivor Space",} -1.0
jvm_memory_max_bytes{area="heap",id="G1 Old Gen",} 5.22190848E8
jvm_memory_max_bytes{area="nonheap",id="Metaspace",} -1.0
jvm_memory_max_bytes{area="nonheap",id="CodeHeap 'non-nmethods'",} 5828608.0
jvm_memory_max_bytes{area="heap",id="G1 Eden Space",} -1.0
jvm_memory_max_bytes{area="nonheap",id="Compressed Class Space",} 1.073741824E9
jvm_memory_max_bytes{area="nonheap",id="CodeHeap 'non-profiled nmethods'",} 1.22916864E8
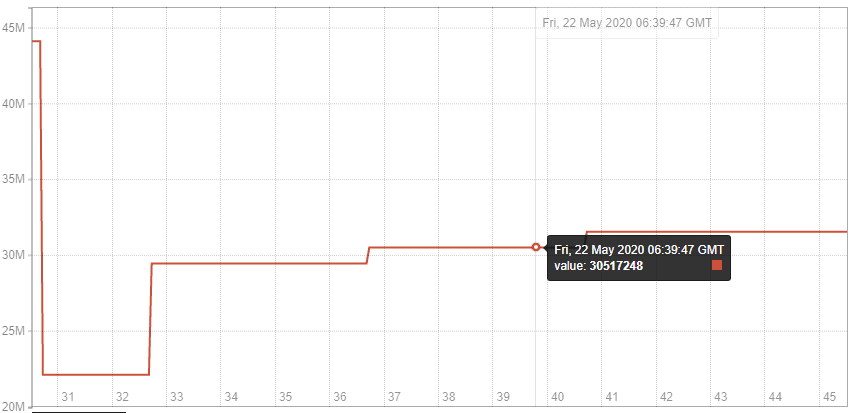
There's a lot of data here, but as an example we might want to plot the total amount of used heap type memory, which we could do in Prometheus with the following query:
sum(jvm_memory_used_bytes{area="heap"})
This uses the Prometheus sum function to add up the used memory across all the types of heap memory areas seen in the id tag above (G1 Survivor Space, G1 Old Gen, and G1 Eden Space).
JVM garbage collection metrics
There are many garbage collection metrics available to get deep insights into how the JVM is managing memory. They can broadly be split into these area:
Pause duration
The jvm_gc_pause_seconds and jvm_gc_pause_seconds_max metrics give us information about how long garbage collection took.
# HELP jvm_gc_pause_seconds Time spent in GC pause
# TYPE jvm_gc_pause_seconds summary
jvm_gc_pause_seconds_count{action="end of minor GC",cause="Metadata GC Threshold",} 1.0
jvm_gc_pause_seconds_sum{action="end of minor GC",cause="Metadata GC Threshold",} 0.005
jvm_gc_pause_seconds_count{action="end of minor GC",cause="G1 Evacuation Pause",} 9.0
jvm_gc_pause_seconds_sum{action="end of minor GC",cause="G1 Evacuation Pause",} 0.074
# HELP jvm_gc_pause_seconds_max Time spent in GC pause
# TYPE jvm_gc_pause_seconds_max gauge
jvm_gc_pause_seconds_max{action="end of minor GC",cause="Metadata GC Threshold",} 0.0
jvm_gc_pause_seconds_max{action="end of minor GC",cause="G1 Evacuation Pause",} 0.004
Memory pool size increase
The jvm_gc_memory_allocated_bytes_total metrics tells us about size increases of the young generation memory pool, whereas the jvm_gc_memory_promoted_bytes_total metric is for the old generation.
# HELP jvm_gc_memory_allocated_bytes_total Incremented for an increase in the size of the young generation memory pool after one GC to before the next
# TYPE jvm_gc_memory_allocated_bytes_total counter
jvm_gc_memory_allocated_bytes_total 2.66338304E8
# HELP jvm_gc_memory_promoted_bytes_total Count of positive increases in the size of the old generation memory pool before GC to after GC
# TYPE jvm_gc_memory_promoted_bytes_total counter
jvm_gc_memory_promoted_bytes_total 1.4841448E7
Live old generation pool size
The jvm_gc_live_data_size_bytes metric tell us the old generation pool size. jvm_gc_max_data_size_bytes tells us the maximum size that can be allocated to the old generation pool.
# HELP jvm_gc_live_data_size_bytes Size of old generation memory pool after a full GC
# TYPE jvm_gc_live_data_size_bytes gauge
jvm_gc_live_data_size_bytes 9039328.0
# HELP jvm_gc_max_data_size_bytes Max size of old generation memory pool
# TYPE jvm_gc_max_data_size_bytes gauge
jvm_gc_max_data_size_bytes 5.22190848E8
JVM thread metrics
These metrics allow you to see what threads you have in your JVM.
# HELP jvm_threads_states_threads The current number of threads having NEW state
# TYPE jvm_threads_states_threads gauge
jvm_threads_states_threads{state="runnable",} 7.0
jvm_threads_states_threads{state="blocked",} 0.0
jvm_threads_states_threads{state="waiting",} 11.0
jvm_threads_states_threads{state="timed-waiting",} 3.0
jvm_threads_states_threads{state="new",} 0.0
jvm_threads_states_threads{state="terminated",} 0.0
# HELP jvm_threads_live_threads The current number of live threads including both daemon and non-daemon threads
# TYPE jvm_threads_live_threads gauge
jvm_threads_live_threads 21.0
# HELP jvm_threads_daemon_threads The current number of live daemon threads
# TYPE jvm_threads_daemon_threads gauge
jvm_threads_daemon_threads 17.0
# HELP jvm_threads_peak_threads The peak live thread count since the Java virtual machine started or peak was reset
# TYPE jvm_threads_peak_threads gauge
jvm_threads_peak_threads 23.0-
jvm_threads_states_threads shows how many threads are in each thread state
-
jvm_threads_live_threads shows the total number of live threads, including daemon and non-daemon threads
-
jvm_threads_daemon_threads shows the total number of daemon threads
-
jvm_threads_peak_threads shows the peak total number of threads since the JVM started
Daemon threads Daemon threads are low priority threads that perform background tasks such as garbage collection
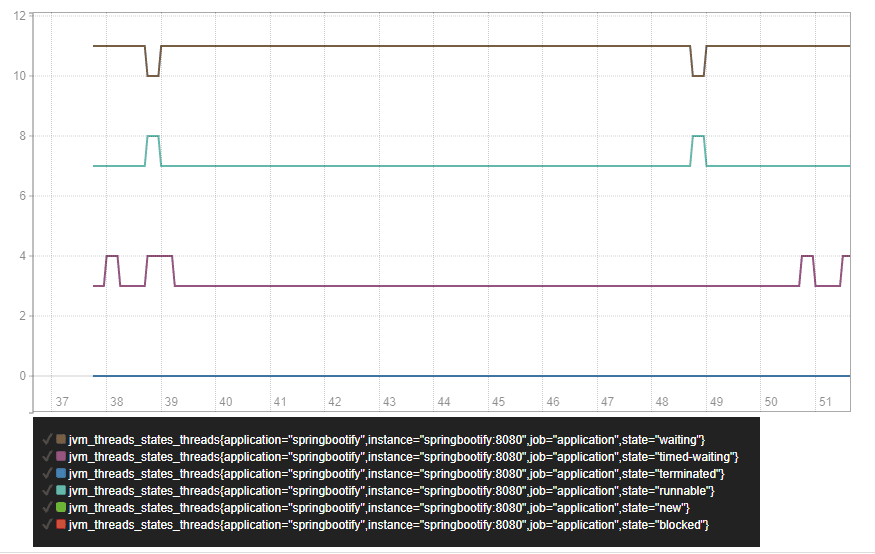
If we execute jvm_threads_states_threads in Prometheus we'll see all the thread states in a graph:
Next steps
Once your application is exposing metrics at /actuator/prometheus you'll want to setup Prometheus to ingest those metrics, and probably a tool like Grafana to be able to create interactive dashboards.
In this article we've covered some of the most useful Spring Boot default metrics. You can of course create custom metrics for measurements specific to your application. Check out the @Timed annotation or read more about the types of metrics you could make use of in your application.
Resources
✅ check out this Spring Boot documentation about the different types of metrics
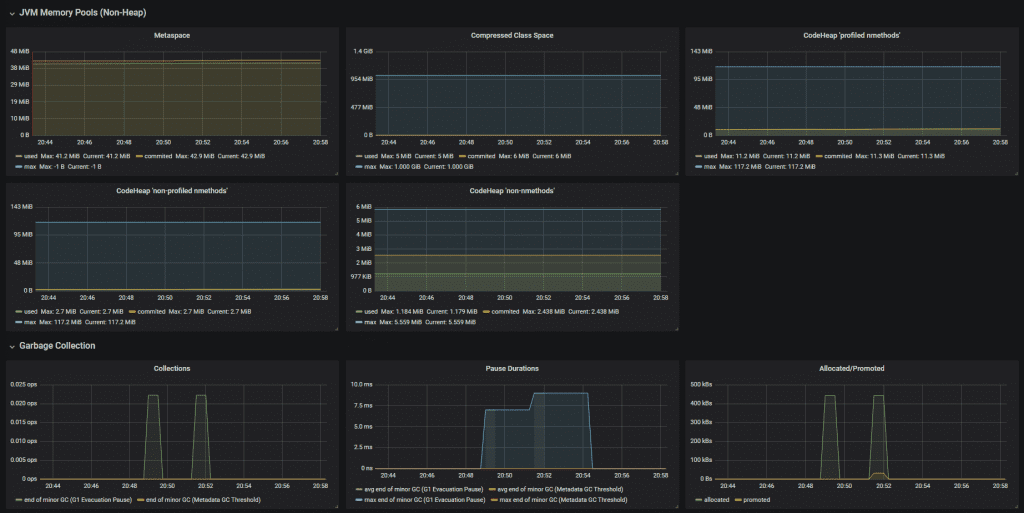
✅ here's a dashboard which you can import into Grafana to neatly display many of the Spring Boot default metrics from this article
✅ if you prefer to learn in video format, check out the accompanying video to this post on my YouTube channel.
If this is a problem you're dealing with in your own team, you can see how I approach software delivery in practice.