Monitoring A Spring Boot Application, Part 1: Fundamentals

Being able to monitor a production application is fundamental in order to be alerted to any issues and quickly find a solution to problems. Many people seem to put in monitoring as an afterthought, or not at all. In this multi-part blog series you'll discover how to setup monitoring, graphing, and alerting for a Spring Boot application.
In part 1, you'll get a birds eye view of the requirements involved in a complete monitoring solution. You'll soon realise that it doesn't take much effort to create a basic monitoring solution for your application.
1. Requirements
Before we get into the details of any specific technologies, it's important to understand what we require from a monitoring solution. For me, monitoring is everything that will allow me to know when there's an issue with my application, and to give me information to figure out what's going on. It should:
- Expose important metrics from within the application
- Aggregate the metrics over time
- Provide a way to configure rules against the metrics
- Send alerts through configurable channels when the rules are broken
- Provide visualisation and graphing capabilities for the metrics
Logging solutions are out of scope for this post.
Let's first run through each of these requirements and add a bit more detail. In the next post in this series, we'll do a deep dive into each of these, showing you exactly how to implement it.
2. Exposing metrics from within a Spring Boot application
Just to be clear, when I use the word metric I'm talking about a measurement of a value from within the application. Here are some examples:
- current memory usage
- the number of HTTP requests
- how long the HTTP requests took (latency)
- the number of threads in use
These are all useful metrics to know about, and fortunately Spring Boot 2.0 exposes all of them for free with some simple configuration:
- add the micrometer-registry-prometheus dependency to your project
- add the spring-boot-starter-actuator dependency to your project
- add the
management.endpoints.web.exposure.include=prometheusproperty to your application.properties
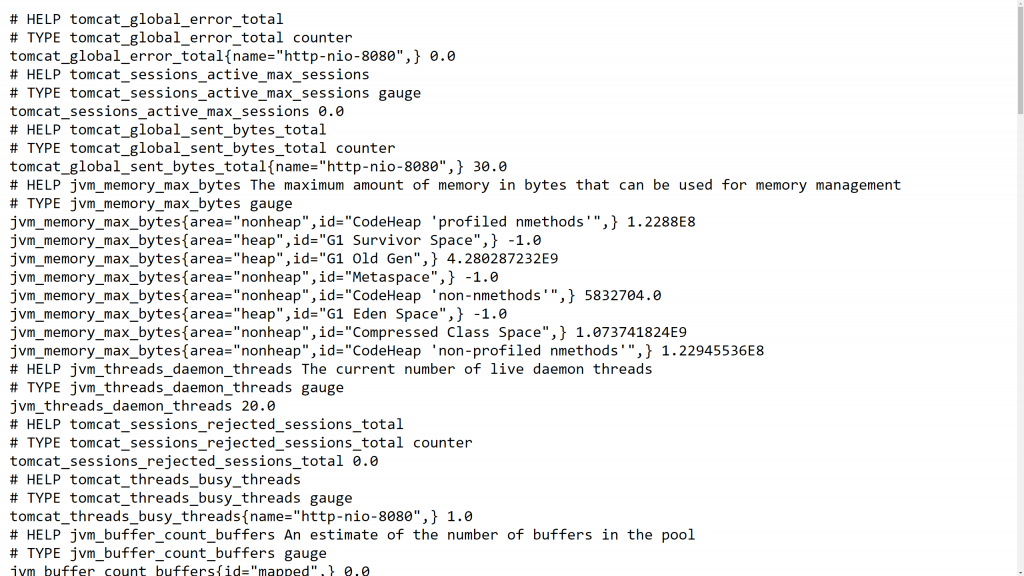
Once these have been added you can browse to /actuator/prometheus to see all the metrics that are exposed by default from your Spring Boot application.
If you don't want to set this up yourself, you can see it running by just running this Docker image that I've made available on Docker Hub:
docker run -p 8080:8080 tkgregory/sample-metrics-application:latest
You can then browse to http://localhost:8080/actuator/prometheus to see the metrics in question:

The metrics you'll see are key value pairs, just a simple metric name and value. They represent the current value of the metric. To aggregate the values over time, so we can see trends, we'll need a separate tool.
3. Aggregating metrics over time
Now that we have metrics exposed by our application, we need a way to pull them and keep a history of them, in order that:
- we can see historical data
- we can see the data over time to calculate measures such as rates
- we can query the data in an easy way
Fortunately a tool exists that allows us to do all of these things, Prometheus. The diagram below is a high level overview of how this service works.

As you can see, it is intermittently polling/scraping whatever applications have been configured. It therefore, contains all the historical data from these applications for whatever time frame we configure.
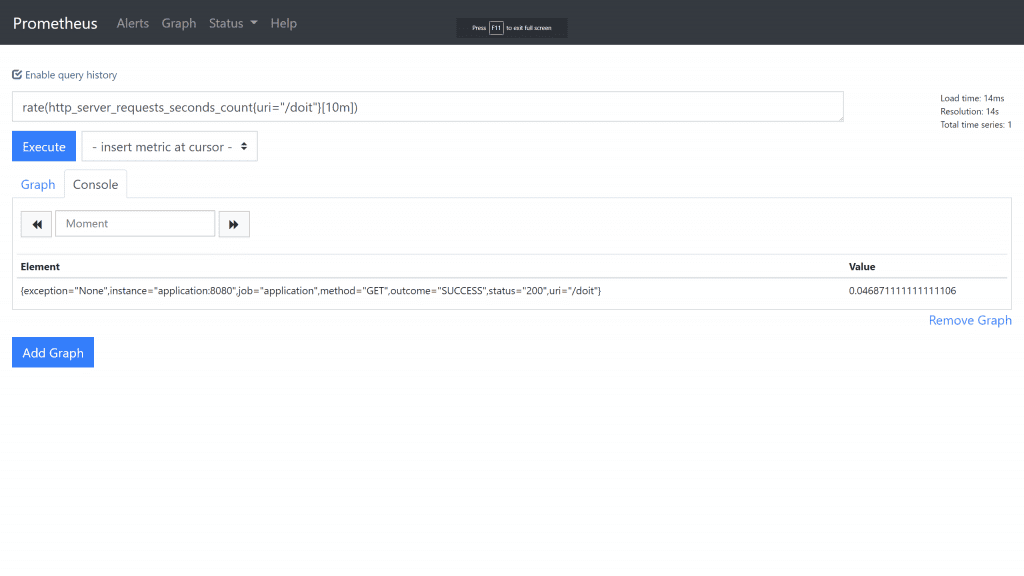
We can also query Prometheus to search the data and bring it back in specific ways that suit our particular needs. Not only this, but other applications can query Prometheus. For instance a graphing application might want to query the rate of application requests over time, to display in a visual format.

A Prometheus query for the rate of requests hitting a particular endpoint
4. Configuring rules against metrics
There's no point having the metrics if we're going to constantly monitor them for any problems in the application. Where's the fun in that?
Instead, it would be better to configure certain rules using the metrics, which if broken, will alert us of the problem. Here are some examples:
- Memory usage greater than 95%
- Number of 404 errors greater than 10% of all requests
- Average response time greater than 500 ms
Prometheus gives us an easy way to configure rules, which when broken will create an alert via another tool call AlertManager.
5. Alerts via configurable channels
When a rule in broken, it needs to be communicated to the appropriate person in some way. This can be tricky, because not all alerts are a "wake me up in the middle of the night" sort of alert, and not all alerts should go to the same person.
Fortunately, AlertManager allows you to configure how exactly you want that alert to be surfaced. When the rule is configured in Prometheus you configure it's labels, which can be used by AlertManager to decide exactly where to send it. For example, you could have a label called application which is used to decide which specific team to send the alert to.
By default, AlertManager can send alerts to many different channels, such as email, Slack, and webhooks.
6. Visualisation and graphing capabilities
When we receive an alert in the middle of the night, there needs to be an easy way to quickly understand what's happening with the application. Some kind of pre-configured dashboard, allowing us to see the most important metrics in visual format would be ideal. After all, data in a visual format is the quickest for us to understand and figure out what to do next.
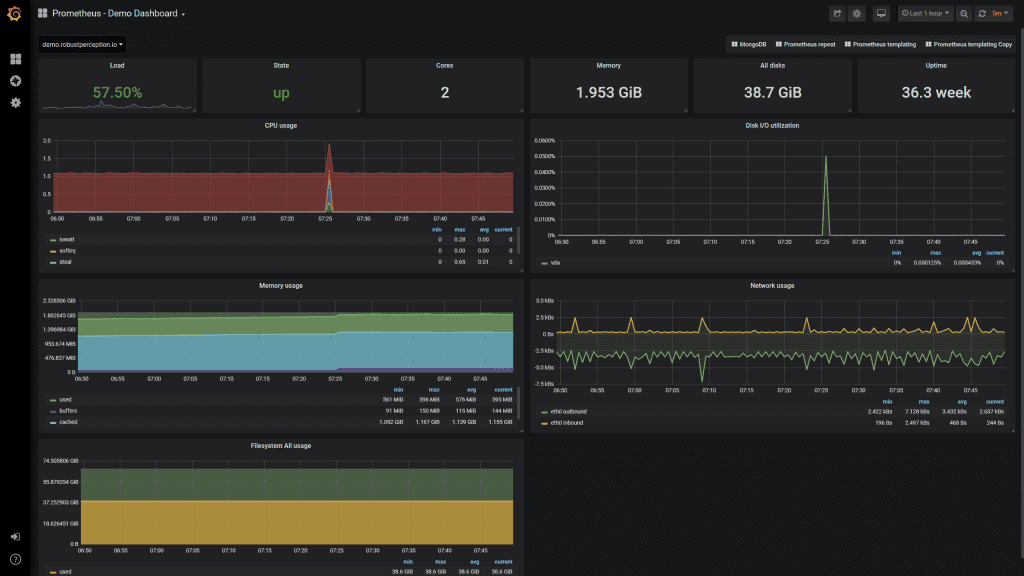
Grafana is such a tool, with an integration directly to Prometheus, and allowing us to build helpful dashboards for our applications. These auto refresh, and provide the ability to zoom in on a particular time period.
What's more, when you've built a dashboard once, you can reuse it for other similar applications. So, if you have a suite of similar Spring Boot microservices, as long as they're exposing similar metrics, you can reuse the same dashboard.

A Grafana dashboard based on Prometheus metrics (see here)
7. Conclusion
Application monitoring is vitally important, and should be thought about during application development rather than bolted on as an afterthought. The tools available today, such as Spring Boot, Prometheus, AlertManager, and Grafana, make it straightforward for us to create a monitoring solution for our application.
In the next article in this series we'll take a deep dive into Prometheus. You'll learn exactly how to set it up to connect to your Spring Boot application, and how to query the data in useful ways.
8. Resources
If you prefer to learn in video format, check out this accompanying video to this post on my YouTube channel.
If this is a problem you're dealing with in your own team, you can see how I approach software delivery in practice.