Monitoring A Spring Boot Application, Part 4: Visualisation & Graphing

Once you've setup metrics for your application, and can query them and alert from them, when something goes wrong you need somewhere to go to quickly get a visual overview of what's happening. In this article, you'll discover how to setup a basic dashboard with Grafana, showing useful graphs to summarise the current state of a Spring Boot application.
This is part 4, the final part of this series on monitoring a Spring Boot application. Be sure to check out the other articles in this series, but especially part 2 about Prometheus, which you'll need to understand at a basic level to follow along with this post.
1. Overview
When you get woken up in the middle of the night by an alert, it might not always be obvious what the problem is. Imagine that the average HTTP request duration has gone above a pre-defined limited of 5 seconds, and you receive an alert.
What's wrong? Who do you need to contact?
Without more information you're going to struggle to answer these questions, especially in an agitated, sleepless state.
With a dashboard, we're trying to provide insights into how the application is behaving. In this example, we might find it useful to see a graph of average request duration over time. A graph of memory usage over time could help to show any problematic spikes that may have happened.
We have to make an educated guess in advance of what information will be required. The dashboard should be continually changing as we learn more and more about what types of issues come up.
In summary, it would be great if we could have a tool that can:
- Create graphs easily from Prometheus metric data
- Visualise data in ways that are most appropriate to the use case
- Show graphs for whatever time period we're interested in
- Create dashboards that can be viewed by others
- Allow us to easily make changes
As you may have guessed, the tool you'll learn about in this article does all these things, and more.
2. Grafana
Grafana is a service which allows you to configure whatever graphs and dashboards you need. It has the possibility to integrate with many different systems, but importantly for us it can query Prometheus.
As discussed in part 2, Prometheus is a service which gathers all the metrics about an application and allows us to query them. Whatever queries you can run in Prometheus, you can also use to create graphs in Grafana. You can see Grafana as a visualisation tool for Prometheus metrics.
3. Working Example
We're going to build on top of the example from part 3, where we had setup a Spring Boot application that generates metrics, Prometheus to scrape those metrics, and AlertManager to send out alerts when any configured rules are broken.
To extend this, we're going to:
- create a Grafana configuration to add a Prometheus datasource
- setup a Grafana container using that configuration, in Docker compose
- import a Spring Boot dashboard
- create a new graph to show request rate data over time
Grafana configuration
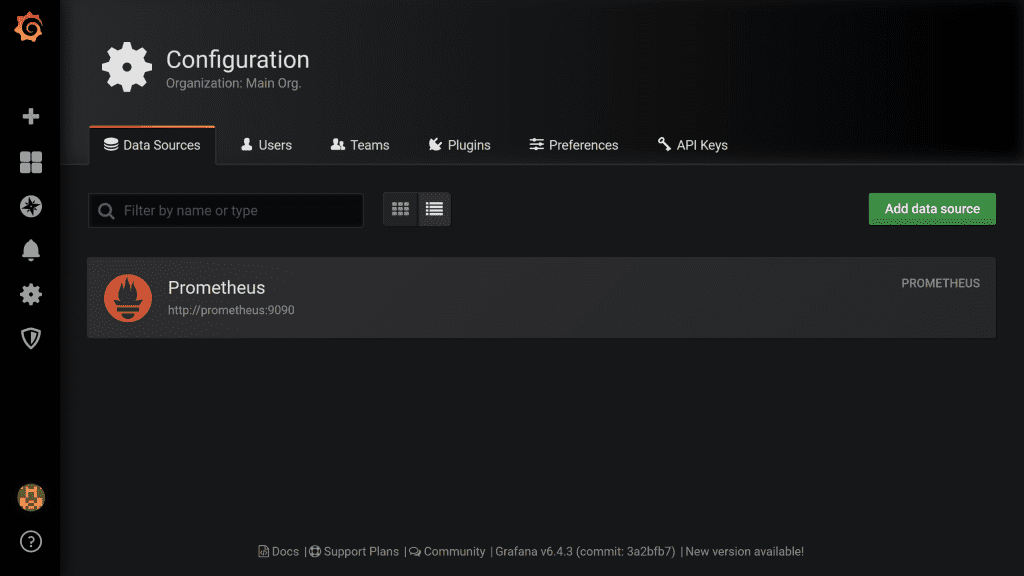
In Grafana, a datasource is simply a place where the data to generate the graphs will come from, in our case Prometheus. So, let's create a file called datasource.yml where we'll configure this:
apiVersion: 1
datasources:
  - name: Prometheus
    type: prometheus
    access: proxy
    url: http://prometheus:9090
Info: this is a minimal configuration that just tells Grafana to create a datasource of type Prometheus, pointing to our Prometheus URL. Remember that by default Docker compose will expose the container name as a hostname, which is why we can reference Prometheus as http://prometheus:9090.
Grafana container
Now let's tell Docker compose to create a Grafana container. Append this section to the end of docker-compose.yml:
grafana:
  image: grafana/grafana
  ports:
    - 3000:3000
  volumes:
    - ./datasource.yml:/etc/grafana/provisioning/datasources/datasource.yml
  depends_on:
    - prometheus
Info: here we're using the standard Grafana docker image from Docker Hub. By default Grafana listens on port 3000. We're mounting a volume so that the configuration file we just created is provided inside the container in the location Grafana expects.
Run docker-compose up and you'll see Grafana running on http://localhost:3000. The default username is admin with password admin.
If you navigate to Configuration (cog icon) > Data Sources, you'll see the Prometheus datasource we just setup:
Import a Spring Boot dashboard
There are a few ready-made Grafana dashboards available for Spring Boot applications. They use the default metrics that Spring Boot provides, to give us some useful graphs to see how our application is behaving. The one I recommend is called JVM (Micrometer).
To import this dashboard, go to Create (plus icon) > Import. Where it says Grafana.com dashboard, paste in 4701, which is the id of this dashboard. You'll see a screen like this:
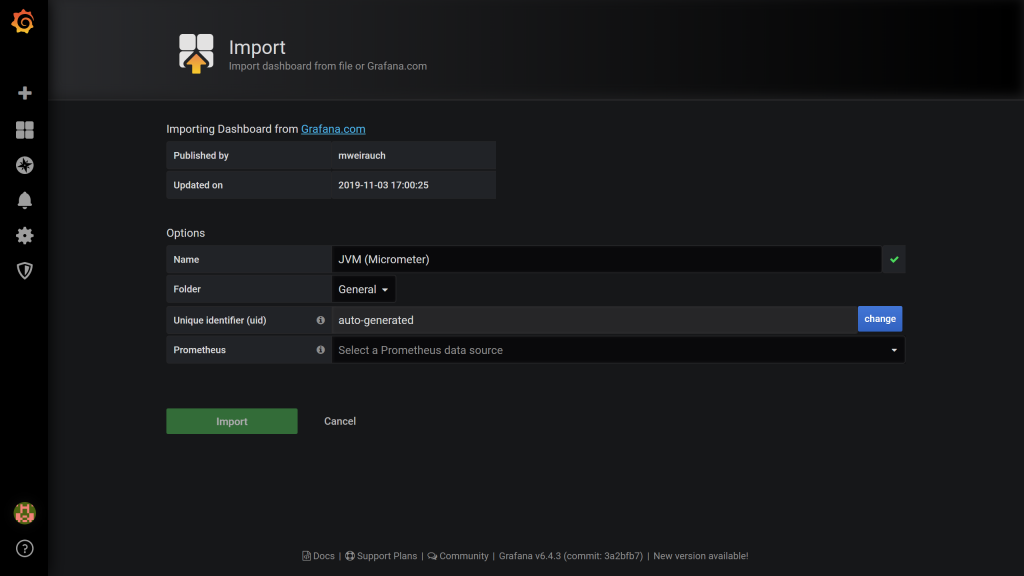
Under Options, where it says Select a Prometheus data source, choose Prometheus from the drop down and then select Import. You'll now see a whole load of graphs.
Don't worry that they don't seem to have much data, because you've probably just started up your container and don't have historic metrics. The default time period is Last 24 hours, but you can change this in the top right hand corner. Select instead, Last 15 minutes, and you'll see the graphs update like this:
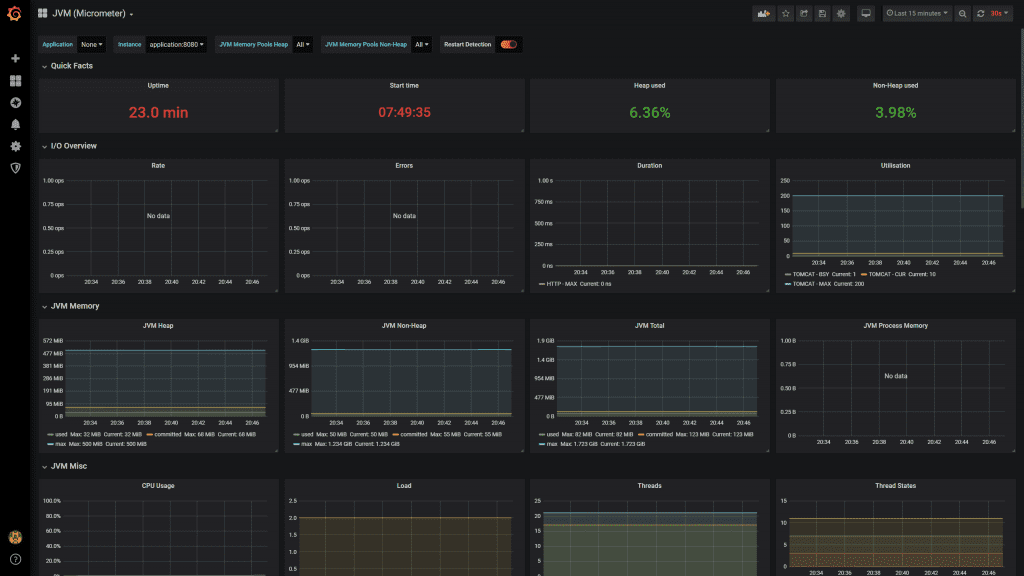
Have a look through this dashboard, and you'll see it has graphs for, amongst others:
- Uptime stats
- IO stats
- JVM stats
- Garbage collection stats
This is by no means everything we'll ever need, but it's definitely a good starting point. Before you move away from this page, be sure to click Save dashboard at the top.
Add a custom graph
These graphs are good, but wouldn't it be nice if we could see the rate of requests to our application over time?
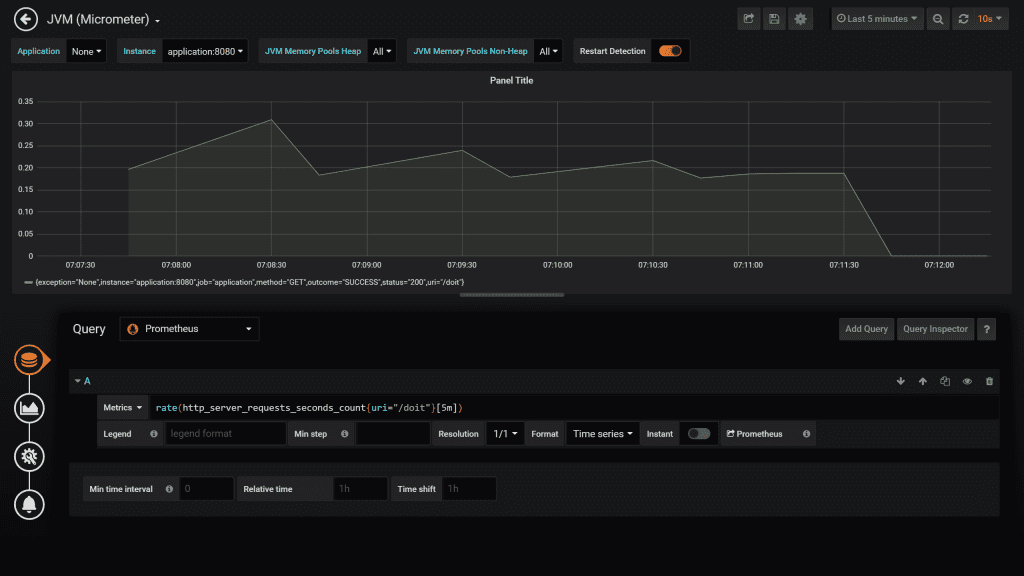
As you saw in part 2, it's easy for us to get this information from a query to Prometheus. For example, the following query will show us the rate of requests to the /doit endpoint:
rate(http_server_requests_seconds_count{uri="/doit"}[5m])
Info: the [5m] in this example tells Prometheus to use metrics from the last 5 minutes only for the rate calculation. The rate returned is a per second rate.
- Click the Add panel button at the top of the dashboard
- Select Add query. You're now on the page where you can setup the details of the graph.
- From the Query drop down menu, select Prometheus
- Where it says Enter a PromQL query enter the query from above,
rate(http_server_requests_seconds_count{uri="/doit"}[5m])and hit enter - You might not see anything on this graph at first, because you haven't generated any requests. Hit http://localhost:8080/doit a few times and wait for a graph like this to appear:
Tip: you can change the refresh rate of the graphs in the top right hand corner.
Let's set a few more properties on the graph:
- Enter /doit in the legend text box
- Click General (cog icon) and enter Request rate into the Title text box
- Click the back arrow in the top left hand corner to go back to the dashboard
Now for the fun part. Drag the graphs around and resize them until you have something looking like this:
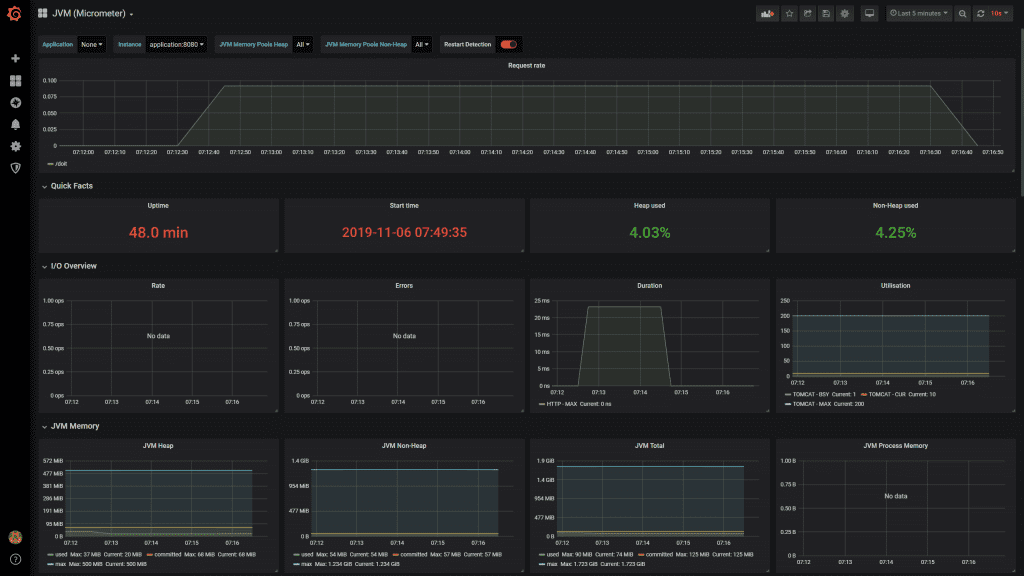
Once again, hit the save button to keep your changes.
4. Conclusion
You've now seen how to setup a Grafana container that uses a Prometheus datasource. In Grafana you've seen how to use pre-existing dashboards to quickly get things up and running, and also how to create simple custom graphs.
At this point, it would be worth playing around with Grafana a bit more. Can you add another line to the graph we added for the request rate for /actuator/prometheus?
This was the final part in the series on monitoring a Spring Boot application. If you haven't already, be sure to check out part 1, part 2, and part 3 to learn all about how to expose metrics from your application, Prometheus, and AlertManager.
5. Resources
- Learn more about the Grafana Docker image over at Docker Hub.
- See the Grafana docs to learn more about this useful tool.
If you prefer to learn in video format, check out this accompanying video to this post on the my YouTube channel.