Using Gradle Build Scan To Optimise Your Build Process

For any keen developer, every time they run the build process they're itching to get coding again. But slow builds put the brakes on your ability to deliver more features.
When the only feedback you get from the build process is its status and duration, how can you even begin to think about optimising it?
Well, if you use Gradle to build Java code you're in luck. There's a way to profile your build process to get key insights into what's going on internally—a bit like debugging or JVM profiling tools.
Like many juicy Gradle features, build profiling is disabled by default, but can be easily switched on. In this article, you'll see how to setup build profiling for your project and use the generated report to diagnose common build issues faced by Java developers.
Generating the Build Scan™ report
To keep this demo realistic, we'll profile a popular open source tool on GitHub called WireMock. It's an API mocking tool that makes integration testing easier.

What WireMock does isn't important. What's important is we can build it with Gradle and profile it. You'll be able to apply the same steps to your own projects.
Within the WireMock project, let's run the Gradle test task.
$ ./gradlew test
...
BUILD SUCCESSFUL in 3m 56s
7 actionable tasks: 2 executed, 5 up-to-date
Right now it takes 3m56s.
Too long for my liking.
So what can we do to figure out where to focus optimisation effort?
Run test again but pass the --scan option to enable Gradle's Build Scan feature.
This runs Gradle in the same way, but at the end sends diagnostic data to Gradle's servers, so you can browse the Build Scan report.
$ ./gradlew test --scan
...
BUILD SUCCESSFUL in 3m 52s
7 actionable tasks: 2 executed, 5 up-to-date

Publishing a build scan to scans.gradle.com requires accepting the Gradle Terms of Service defined at https://gradle.com/terms-of-service.
Do you accept these terms? [yes, no] yes
Gradle Terms of Service accepted.

Publishing build scan...
https://gradle.com/s/frstfccszyub4
Type yes to accept Gradle's terms and conditions and gain access to the build scan.
If this raises a security red flag for you, I'll share a totally private option later.
Open the provided URL in a browser and enter your email.

You'll receive an email with a link to the Build Scan report. If you select Remember me on the above page, you only have to follow this process once.
Analysing the report
Here's the Build Scan report homepage for our WireMock build.
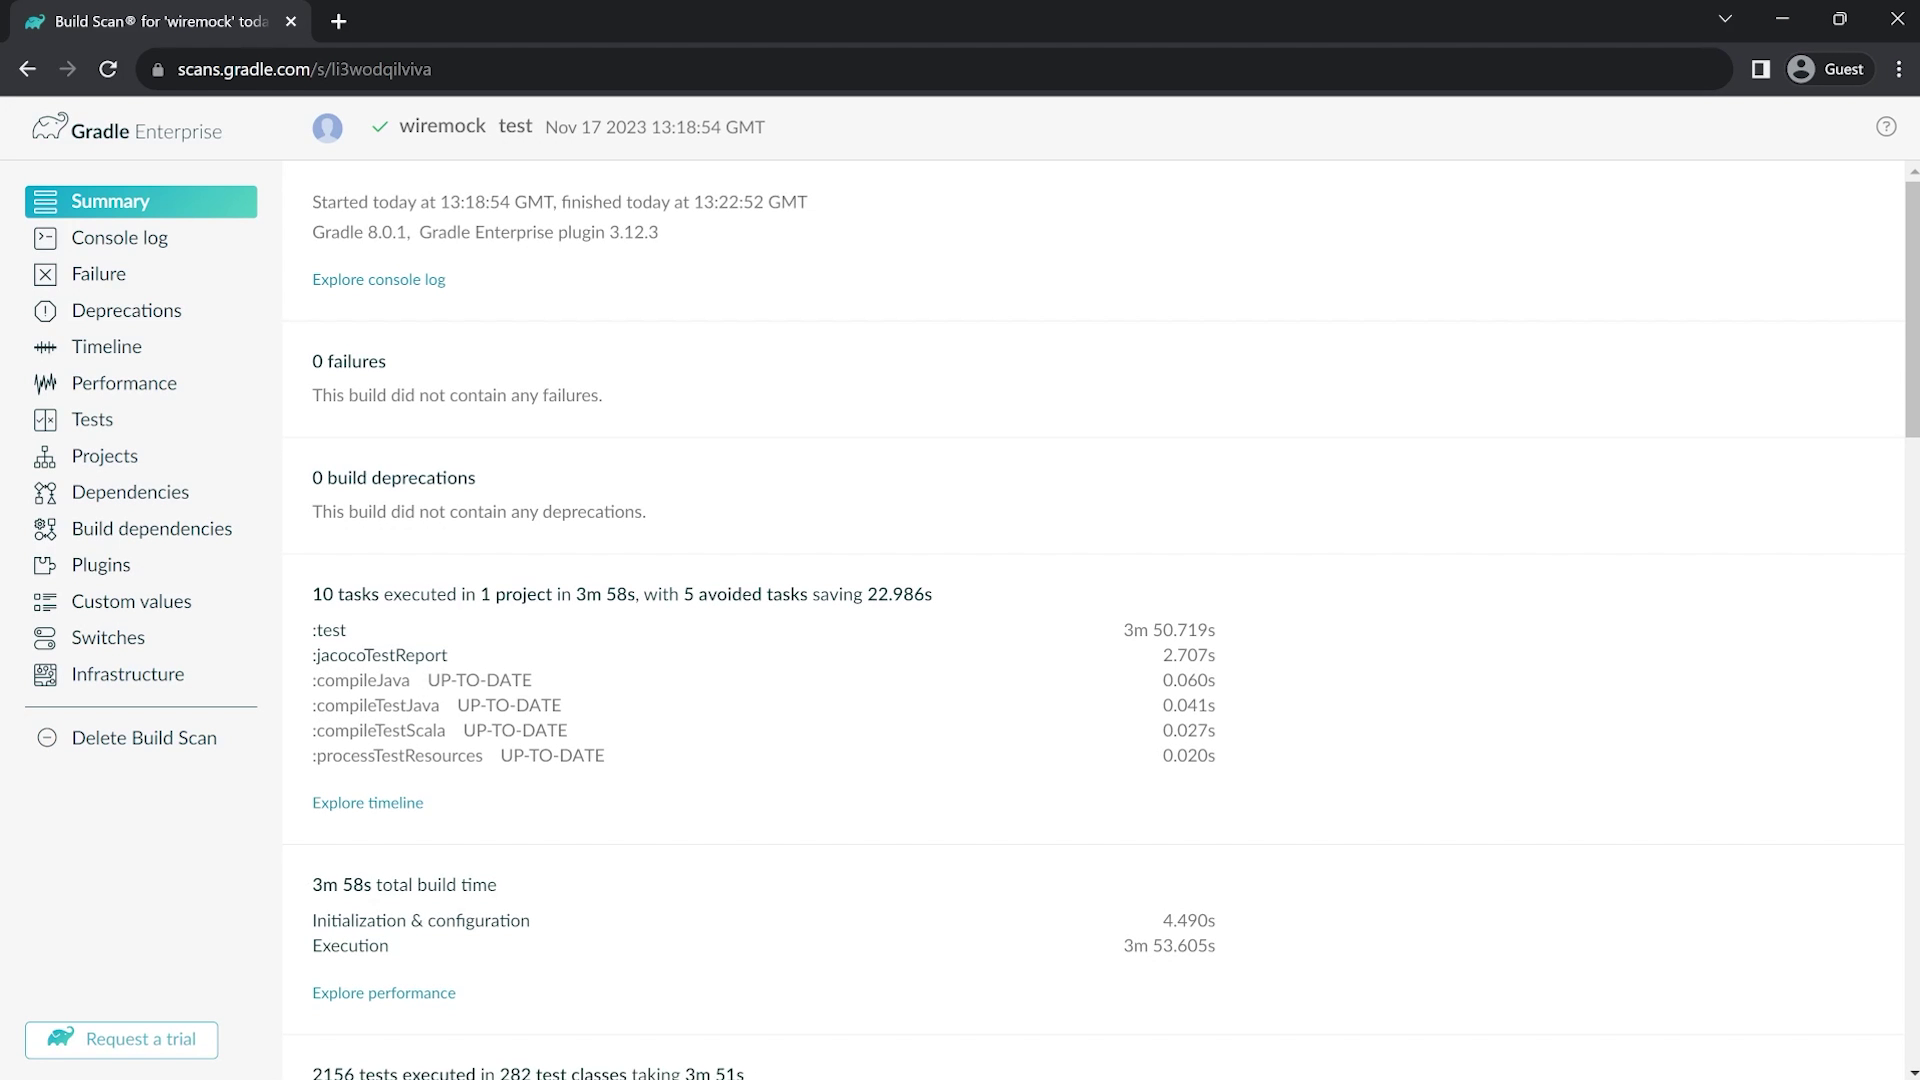
--scan to generate a build report viewable on Gradle's servers.Under each option on the left are enough diagnostics to make a data scientist think Christmas came early. So I'll show you the 3 most useful reports to diagnose build performance issues.
1. Homepage report
On the homepage you see the build duration with a breakdown of individual tasks.

In this case, the test task took the longest, which gives a clearer idea where to focus optimisation effort.
2. Timeline report
Under Timeline you see a visualisation of the whole build process. In this case, because the test task took so long we have to zoom in to see the other tasks.

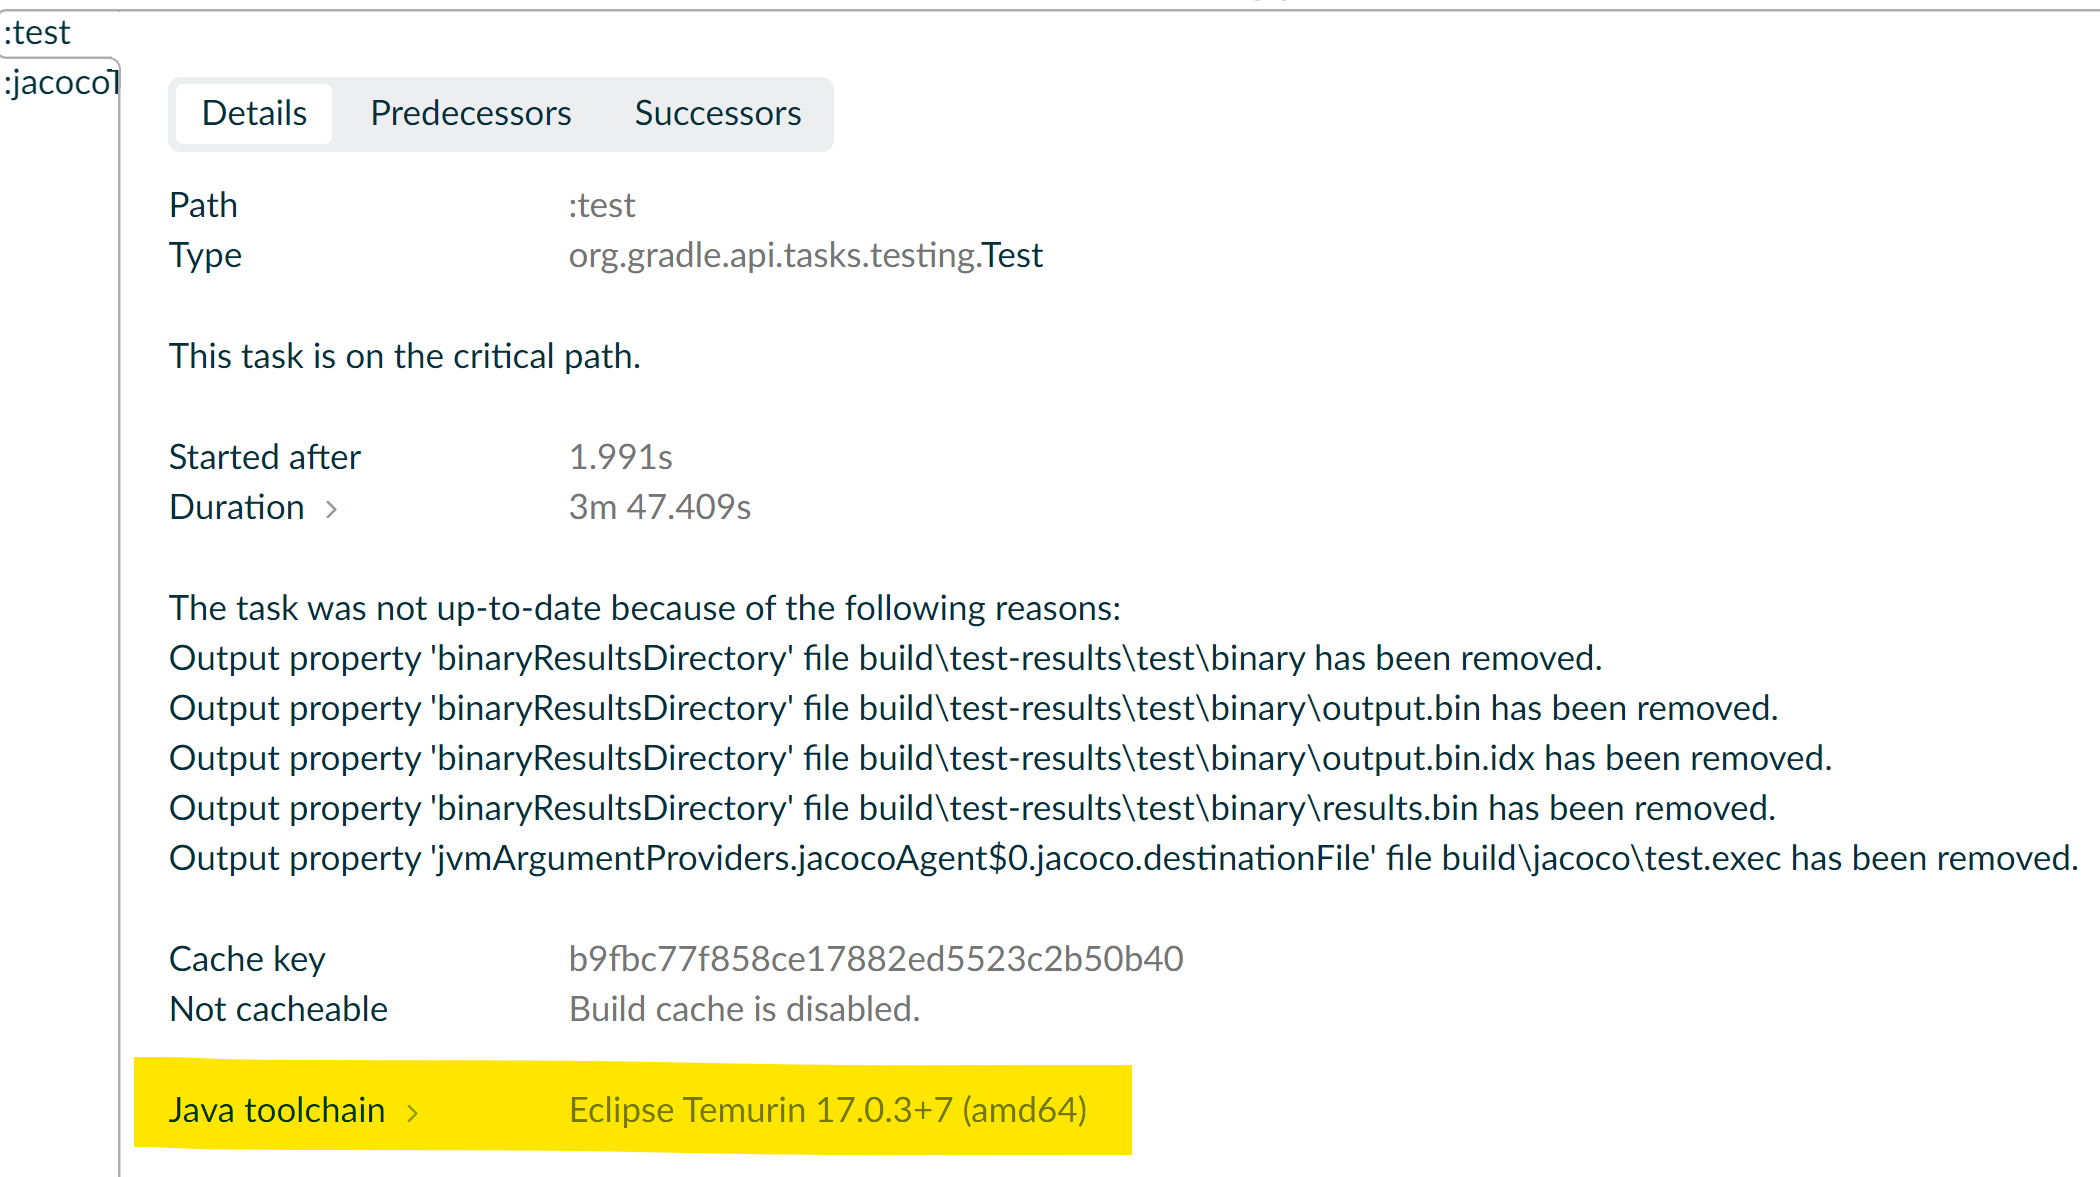
Below the timeline a list of tasks. Hit the icon next to the task name to get super-detailed diagnostics about the task execution.
For example, here are the test task details with info like the Java version used.
3. Tests report
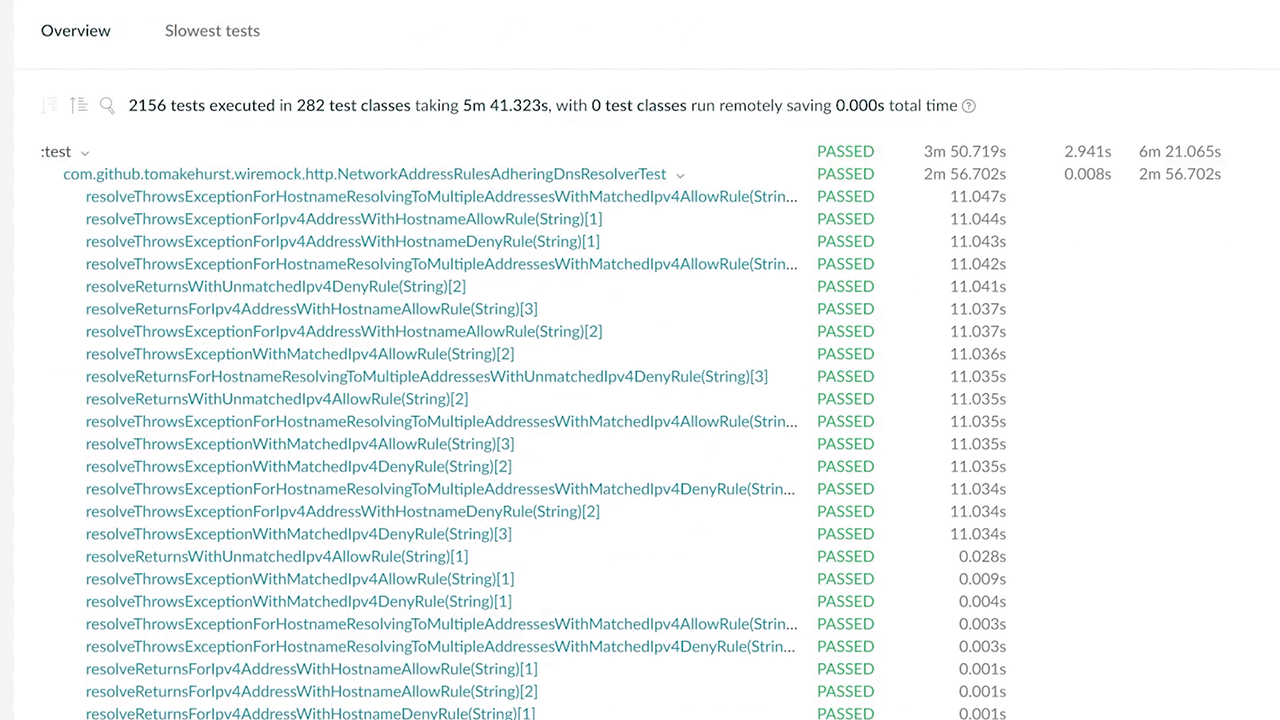
Go to Tests to see info on test classes and their individual test cases.
Click Slowest tests to see tests ordered by duration.
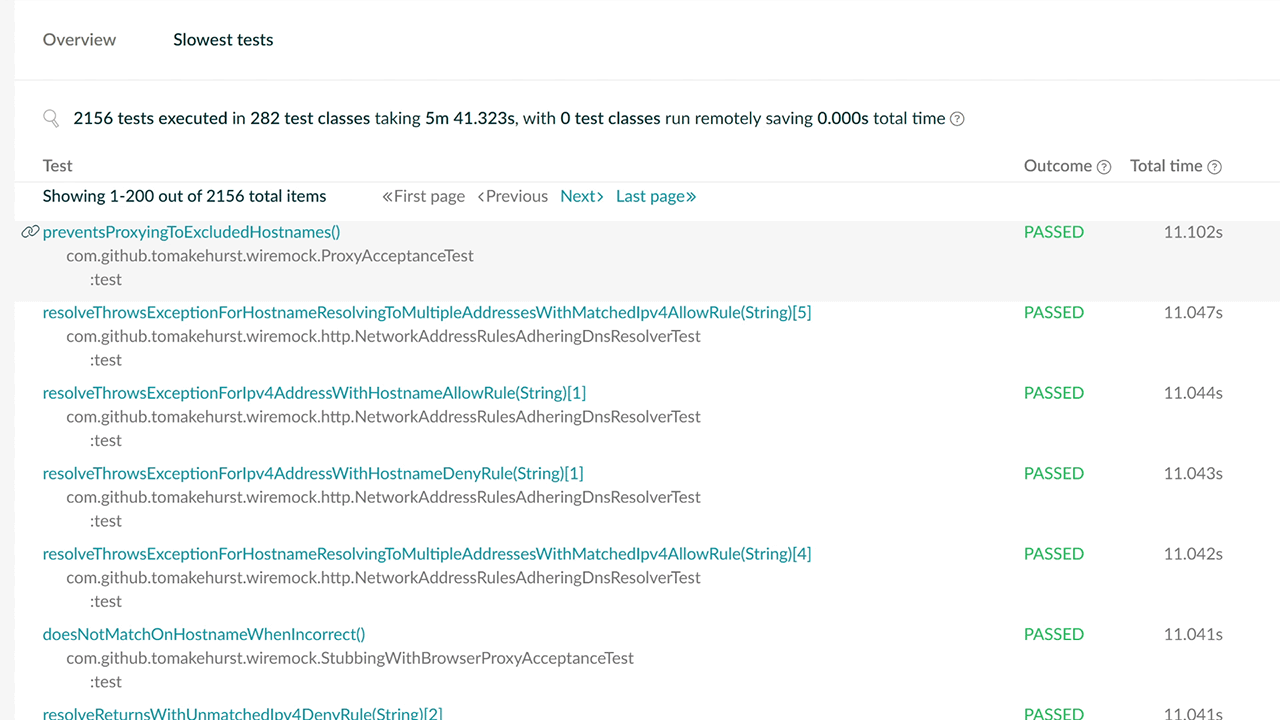
This reveals a handful of really slow tests with the rest taking less than a second. You'll find some ideas on how best to optimise this at the end.
Local-only profiling
The great thing about build scans is you can share a link with colleagues so they can help look for possible improvements. For example, here's the URL for the build scan generated above: https://gradle.com/s/frstfccszyub4. Feel free to visit the URL yourself.
The downside is that even though the URL contains a random string, it's still public.
Of course, to publish and view a build scan you have to actually send data to Gradle's servers.

If that makes you nervous, here's another option.
Run the same Gradle task with --profile to generate a locally viewable report.
This time, none of your data gets sent to Gradle.
$ ./gradlew test --profile
...
BUILD SUCCESSFUL in 3m 54s
7 actionable tasks: 2 executed, 5 up-to-date

See the profiling report at: file:///C:/workspace/wiremock/build/reports/profile/profile-2023-11-22-20-50-41.html
A fine-grained performance profile is available: use the --scan option.
Click the link to access the report, generated in the build/reports/profile directory.
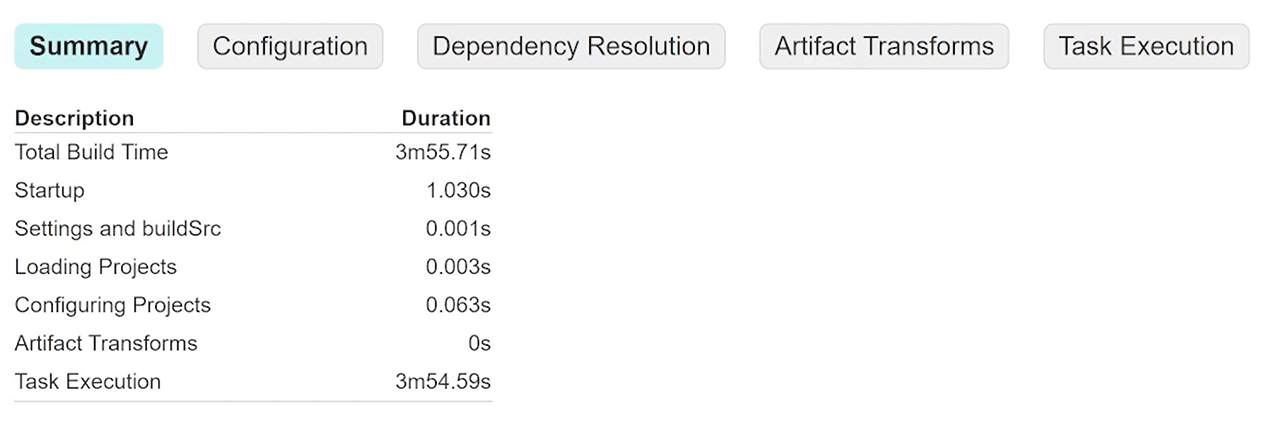
--profile to profile your build locally without sending data to Gradle.The report is nowhere near as detailed as that of Build Scan, but it might give you just enough information to overcome that hurdle you're facing.
Final thoughts
If you're suffering from slow tests like the above Build Scan shows, you have two options.
- Invest time figuring out how to make individual tests faster by changing test code.
- Configure the environment to make tests execute faster without any code changes.
The second option is the easiest and you'll be surprised how much time you save with just a few lines of build script config.
So check out this article to see how I halved unit test time with just a 4 line change.
Lack of Gradle knowledge slowing you down?
A broken build is easy enough to fix. But a misconfigured build is the silent time killer that costs hours every week.
Slow builds. Slow tests. Slow development.
But the official Gradle docs are confusing. Most developers never properly configure their projects—and as codebases grow, builds become bottlenecks.

This guide fixes that. It's a step-by-step walkthrough for Java developers who want to master Gradle fast.
- Unlock the mysteries of the build script.
- Speed up your workflow.
- Make development fun again.
If this is a problem you're dealing with in your own team, you can see how I approach software delivery in practice.