Prometheus service discovery for AWS ECS

Having Prometheus automatically discover your AWS ECS services makes life a lot easier since you don't have to manage Prometheus target configurations across environments.
Although Prometheus doesn't provide it out-of-the-box, in this article you'll discover exactly how to setup service discovery for ECS by combining a few simple tools. By the end, we'll have a full working example with Prometheus running in AWS ECS and discovering other ECS services whose metrics we're interested in.
Why pair Prometheus with ECS?
AWS ECS is an orchestration service for Docker containers, allowing you to easily manage and scale your applications with easy access to other AWS services.
As modern forward-thinking developers, when we're writing applications to run on ECS, monitoring and metrics are at the forefront of our minds. This is especially important because microservices architectures produce a proliferation of services that need to be monitored 24/7.
A great solution to this problem is Prometheus, with the ability scrape metrics from any application that publishes them. We can then run queries against the metric data in Prometheus, to find out things such as request rate, response time, or even just if our service is up or down.
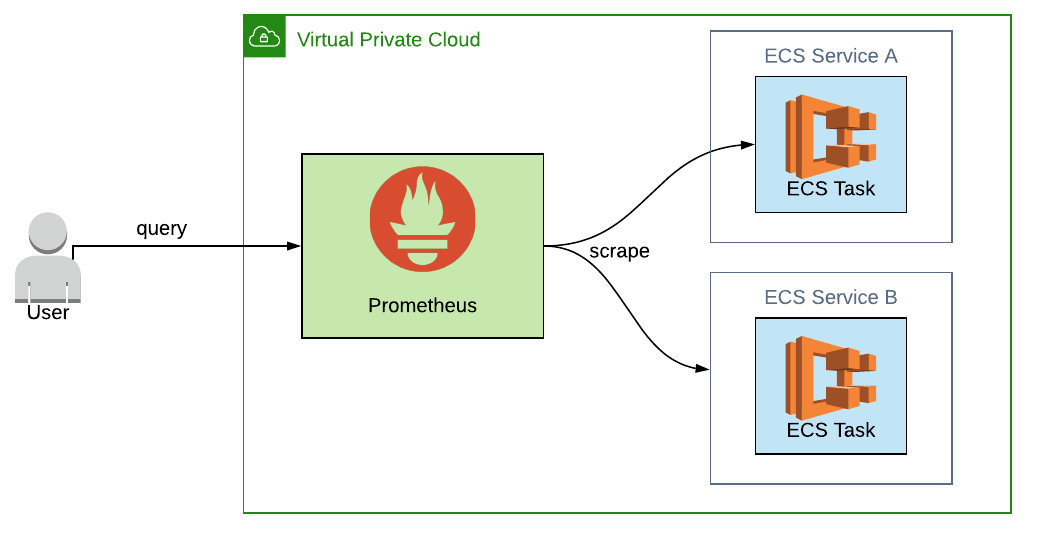
This diagram shows the scenario where we've got two microservices running, Service A and Service B, as ECS services. Each service contains an ECS task, and Prometheus is happily scraping the metrics from them. The ECS task could be any application that exposes metrics, such as a Spring Boot application offering up metrics at /actuator/prometheus.
ECS tasks and services
Remember that an ECS task is an actual running application (i.e. Docker container). An ECS service is a management level resource which handles things like ensuring the right number of tasks are running and networking. In this article these terms are sometimes used interchangeably.
Traditional Prometheus configuration
To tell Prometheus which ECS tasks it needs to scrape metrics from, a YAML configuration file can be provided defining the scrape_configs.
scrape_configs:
  - job_name: 'application-a'
    metrics_path: '/actuator/prometheus'
    static_configs:
      - targets: ['application-a:8080']
  - job_name: 'application-b'
    metrics_path: '/actuator/prometheus'
    static_configs:
      - targets: ['application-b:8080']
Here's a fairly unexciting configuration telling Prometheus to scrape metrics from the two separate microservices in the diagram above. They each expose a metric endpoint at /actuator/prometheus.
This all seems fairly straightforward, right? As we increase the number of services deployed into ECS, we can add more entries to our scrape_configs. ✅
ECS service discovery vs. Prometheus service discovery for ECS
The domain names used in the above Prometheus configuration, such as application-a, could have been generated using ECS Service Discovery (different from Prometheus service discovery for ECS, the topic of this article).
This allows you to register an A record in a private DNS namespace, mapping a domain name such as application-a to one or more private IP addresses. Here's how the A records for the our two ECS services might look:

Why use Prometheus service discovery?
Following on from the previous example, things start to become more complicated when we do the following:
1. Increase the number of tasks in each ECS service
If we started experiencing high load and needed to scale ECS Service A up to two tasks, we'd have something like this:
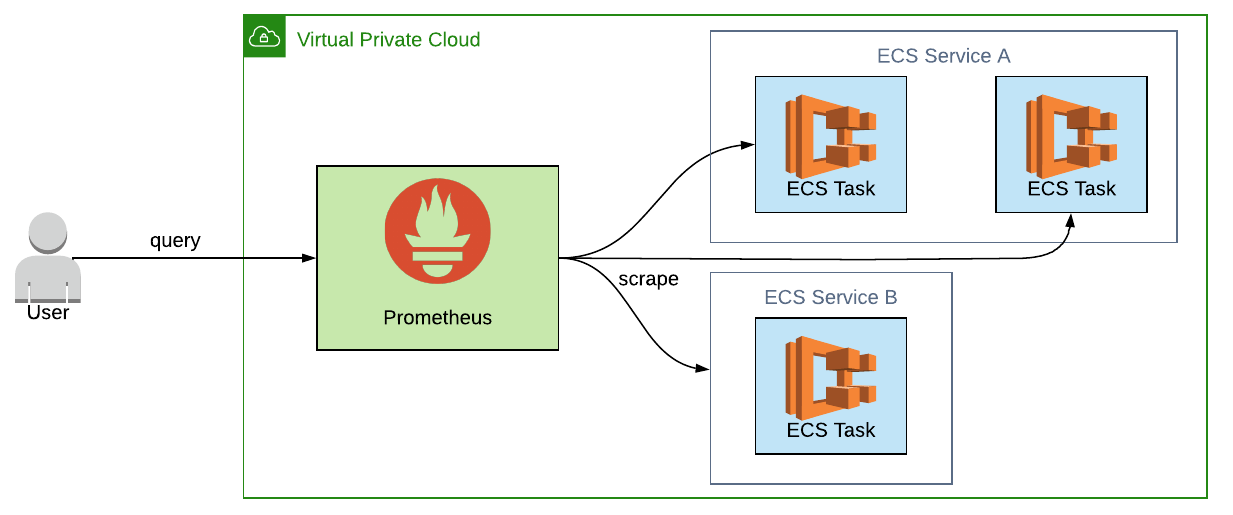
How then do we update our Prometheus configuration to reflect this? After all, we want to scrape metrics from each individual task since each one needs to be monitored separately.
Sadly, there seems to be no simple answer as we still only have a single domain name that now maps to two IP addresses for the two ECS tasks.
Our options are limited, because:
-
we can't use the application-a domain name in the Prometheus configuration since we need to scrape two targets. i.e.
targets: ['application-a:8080','application-a:8080']would not help -
we can't configure Prometheus with the individual private IP addresses of the ECS tasks as these change dynamically as tasks are added or removed, so the Prometheus configuration would become quickly out of date
2. Add services in different VPCs
A Virtual Private Cloud (VPC) is your own separate private network in the AWS cloud. Depending on what architecture you choose, you may end up having separate VPCs for your different environments (e.g. UAT, preprod, prod). Each of those VPCs may in turn have a different set of ECS services.
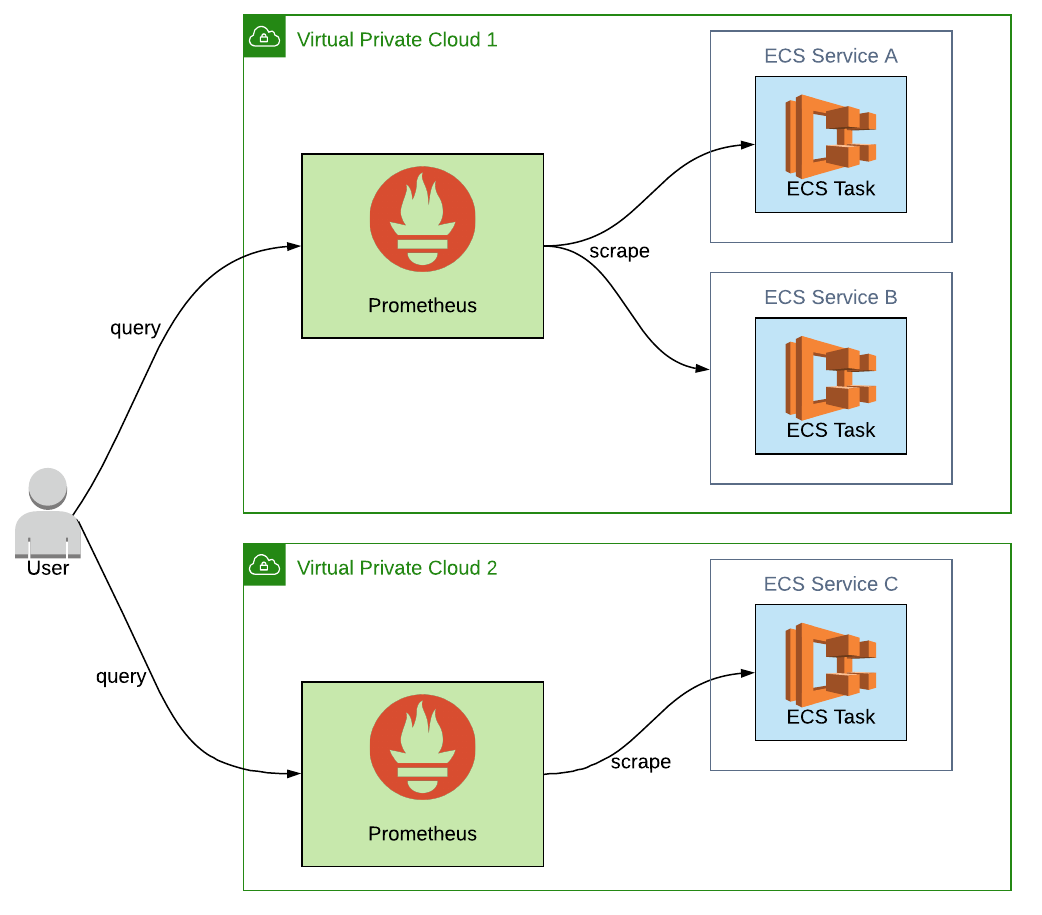
One approach to deal with ECS services in different VPCs, shown in this diagram, is to have a separate Prometheus instance per VPC. This works well, as networking between Prometheus and the individual ECS tasks is possible as they're on the same private network.
From a configuration standpoint though, we now need to be able to configure Prometheus differently per VPC, introducing even more complexity.
Service discovery to the rescue
Wouldn't it be great then if we could deploy a Prometheus service that would auto-discover any ECS tasks it finds in the same VPC?
This would mean that:
-
Prometheus could discover the IP address of individual tasks of ECS services. If an ECS service scaled up to many tasks, then Prometheus would find them all
-
Prometheus could discover ECS tasks for whatever ECS services are deployed into a particular VPC. If ECS services were added or removed, Prometheus would find them.
If only...🤔
Prometheus service discovery for ECS using the AWS API
The best way to get up to date information about ECS tasks in your AWS account is through the AWS API. It can return the private IP address and port required for Prometheus to scrape metrics, along with other metadata.
The prometheus-ecs-discovery service
The good news is that an application to query the AWS API has already been made available to us, in the prometheus-ecs-discovery GitHub repository. It outputs a config file ready for Prometheus to ingest.
I've made the application available as a Docker image tkgregory/prometheus-ecs-discovery on DockerHub. Let's give it a go by running it like this:
docker run -v <local-aws-dir>:/root/.aws -e AWS_REGION=<aws-region> --rm tkgregory/prometheus-ecs-discovery
-
the
-vflag specifies a volume, in this case my .aws directory so that the application running in the Docker container can access credentials for calling the AWS API -
the
-eflag specifies an environment variable to set the AWS region, which the application is expecting
If you have any ECS tasks running, tagged with the correct DockerLabels (see later section), this produces log output like this:
2020/06/14 07:29:49 Inspected cluster arn:aws:ecs:eu-west-1:299404798587:cluster/deployment-example-cluster, found 3 tasks
2020/06/14 07:29:50 Described 3 tasks in cluster arn:aws:ecs:eu-west-1:299404798587:cluster/deployment-example-cluster
2020/06/14 07:29:50 Writing 2 discovered exporters to ecs_file_sd.yml
Awesome! So prometheus-ecs-discovery has gone off and queried the AWS API and discovered three ECS tasks, two of which have been written to ecs_file_sd.yml. Only two of the three targets were written to the file, because one didn't specify the required Dockerlabels.
Let's take a look at that file by running docker exec 1d /bin/sh -c "cat ecs_file_sd.yml":
- targets:
  - 10.0.0.148:8080
  labels:
    task_arn: arn:aws:ecs:eu-west-1:299404798587:task/1219b467-cbe9-4b13-9391-0036b1370615
    task_name: sample-metrics-application-task
    task_revision: "6"
    task_group: service:prometheus-service-discovery-for-ecs-ServiceA-160YJ2EMM9TY5
    cluster_arn: arn:aws:ecs:eu-west-1:299404798587:cluster/deployment-example-cluster
    container_name: sample-metrics-application
    container_arn: arn:aws:ecs:eu-west-1:299404798587:container/28324e9d-d84f-4ea0-a9cf-8fe0150ee398
    docker_image: tkgregory/sample-metrics-application
    __metrics_path__: /actuator/prometheus
- targets:
  - 10.0.0.154:8080
  # labels similar to above
You can see in the YAML output we have a list of targets, importantly with the private IP address and port of the ECS task. The application has also output a load of metadata into the labels section, which could prove useful later down the line when querying the metrics in Prometheus.
Prometheus service discovery config
Prometheus needs to be supplied a list of targets, the host/IP and port of each service from which metric data should be scraped. There are many ways to configure this, such as defining the targets in the Prometheus configuration file scrape_config element or using one of the built in service discovery mechanisms.
Using one such mechanism, file based service discovery, Prometheus will read the targets from a file, whose location is specified in the configuration file with the file_sd_config element. Prometheus will also intermittently reload this file (every 5 minutes, by default).
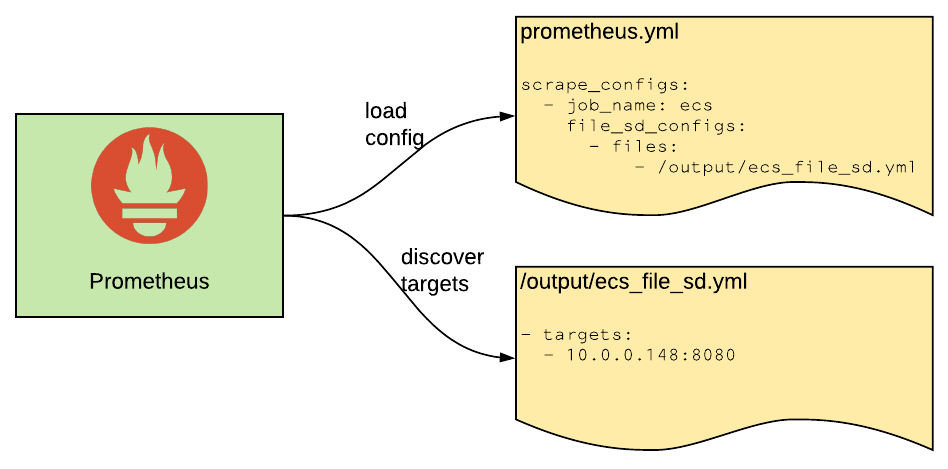
This is perfect for our use case since the prometheus-ecs-discovery will intermittently write the list of targets to a file, which Prometheus can then ingest. ✅
A solution is formed
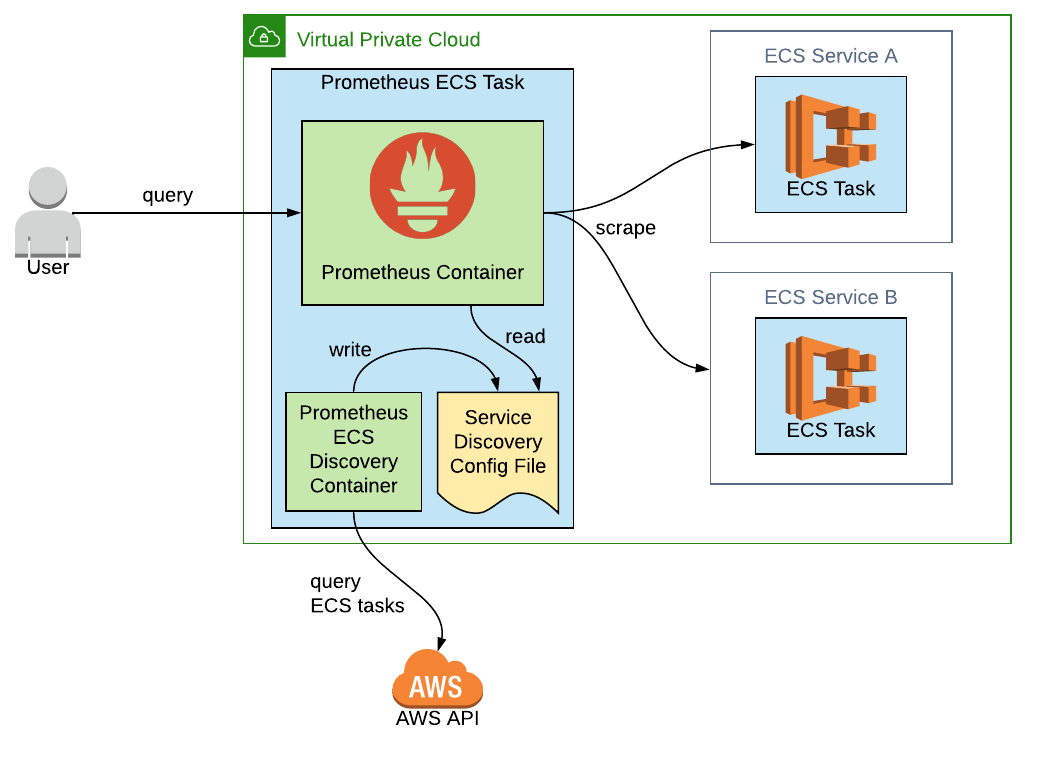
Bringing these ideas together, we're going to need a way to run both the Prometheus and prometheus-ecs-discovery containers side-by-side with access to the same file where the list of targets will be written and read.
It's time to get creative! An ECS task can actually run two separate containers, allowing us to then share a mounted volume between them. In fact, this is one of AWS's recommended use cases for using multiple containers:
You should put multiple containers in the same task definition if...your containers share data volumes.
This is ideal, since we can have the prometheus-ecs-discovery container writing targets to a file and the Prometheus container reading from that file.
A full working example in CloudFormation
Let's demonstrate this process working end-to-end by setting this up in AWS using CloudFormation. I suggest reading through the description below first, then trying this out yourself by clicking Launch Stack to create the resources in your own AWS account.
We're going to create the following resources, the most important of which we'll run through in more detail. The CloudFormation resource types are show in bold:
Networking
Base setup on top of which we can add ECS services etc.
-
a VPC & public Subnet
-
a RouteTable, Route, & SubnetRouteTableAssociation
-
an InternetGateway & VPCGatewayAttachment
Applications to be monitored
Two microservices which publish metrics in the Prometheus compatible format.
-
an ECS Cluster
-
a ECS TaskDefinition for a service which publishes Prometheus metrics
-
2 x ECS Service which use that Task Definition
-
a SecurityGroup for the service to allow access on port 8080
Prometheus
Prometheus with service discovery for ECS.
-
an ECS TaskDefinition for Prometheus, including both the Prometheus and prometheus-ecs-discovery containers
-
an ECS Service for Prometheus, using that Task Definition
-
a SecurityGroup for Prometheus, to allow access on port 9090
-
a task execution Role for Prometheus, required since we want permission to use the
awslogslogging driver -
a task Role for Prometheus, required to allow access to the relevant AWS APIs
-
a LogGroup for Prometheus
We're going to skip over most of the Networking and Applications to be monitored resources since if you're reading this article you're probably already familiar with those parts. You can always view the example CloudFormation template directly to get all the details.
The only thing to note is that in whatever application you want to monitor you need to add some specific DockerLabels. Below is the TaskDefinition for the application defined in the CloudFormation that we're going to monitor, with the relevant DockerLabels highlighted:
  TaskDefinition:
    Type: AWS::ECS::TaskDefinition
    Properties:
      Family: !Sub sample-metrics-application-task
      Cpu: 256
      Memory: 512
      NetworkMode: awsvpc
      ContainerDefinitions:
        - Name: sample-metrics-application
          Image: tkgregory/sample-metrics-application
          PortMappings:
            - ContainerPort: 8080
          DockerLabels:
            PROMETHEUS_EXPORTER_PATH: /actuator/prometheus
            PROMETHEUS_EXPORTER_PORT: 8080
      RequiresCompatibilities:
        - EC2
        - FARGATE
The PROMETHEUS_EXPORTER_PATH and PROMETHEUS_EXPORTER_PORT labels are used by the prometheus-ecs-discovery application to know where the metrics are located. It will only output a task to the targets file if they are present.
Prometheus Task Definition
The most important resource to understand is the Prometheus task definition. As already mentioned, this contains definitions for two containers:
-
Prometheus - we'll be using a customised version of Prometheus from this DockerHub image. It's exactly the same as the standard Prometheus, except it allows us to load a configuration file from a URL. This is convenient when starting Prometheus with the
Fargatelaunch type (AWS manages the underlying EC2 resources), as there's no way to supply a configuration file from the file system. -
prometheus-ecs-discovery - I've made this application available as a DockerHub image
These ContainerDefinitions entries contain MountPoints to the same SourceVolume, all highlighted below. This is where the file containing the list of Prometheus targets will be stored.
  PrometheusTaskDefinition:
    Type: AWS::ECS::TaskDefinition
    Properties:
      Family: prometheus-for-ecs
      Cpu: 256
      Memory: 512
      NetworkMode: awsvpc
      TaskRoleArn: !Ref PrometheusRole
      ExecutionRoleArn: !Ref PrometheusExecutionRole
      Volumes:
        - Name: config
      ContainerDefinitions:
        - Name: prometheus-for-ecs
          Image: tkgregory/prometheus-with-remote-configuration:latest
          Environment:
            - Name: CONFIG_LOCATION
              Value: !Ref PrometheusConfigLocation
          PortMappings:
            - ContainerPort: 9090
          MountPoints:
            - SourceVolume: config
              ContainerPath: /output
          LogConfiguration:
            LogDriver: awslogs
            Options:
              awslogs-group: !Ref PrometheusLogGroup
              awslogs-region: !Ref AWS::Region
              awslogs-stream-prefix: prometheus-for-ecs
        - Name: prometheus-ecs-discovery
          Image: tkgregory/prometheus-ecs-discovery:latest
          Command:
            - '-config.write-to=/output/ecs_file_sd.yml'
          Environment:
            - Name: AWS_REGION
              Value: !Ref AWS::Region
          MountPoints:
            - SourceVolume: config
              ContainerPath: /output
          LogConfiguration:
            LogDriver: awslogs
            Options:
              awslogs-group: !Ref PrometheusLogGroup
              awslogs-region: !Ref AWS::Region
              awslogs-stream-prefix: prometheus-ecs-discovery
      RequiresCompatibilities:
        - EC2
- FARGATE- the Prometheus
ContainerDefinitionsentry has anEnvironmententry forCONFIG_LOCATION. This CloudFormation template has a default value for this, which is a Prometheus configuration I've got hosted here in S3. It's very simple, and just tells Prometheus to load targets from a specific file every one minute:
scrape_configs:
  - job_name: ecs
    file_sd_configs:
      - files:
          - /output/ecs_file_sd.yml
refresh_interval: 1m-
the prometheus-ecs-discovery
ContainerDefinitionsentry passes a specific command to the Docker container, in this case using the-config.write-toparameter to specify the path of the file to which the ECS targets should be written (see this page for a list of all available parameters). -
the prometheus-ecs-discovery has an
Environmententry forAWS_REGION. Here we can use theAWS::RegionCloudFormation parameter that comes as standard, which represents the current region we're deploying to. -
both containers use the
awslogsLogConfiguration, meaning that we'll be able to see logs in AWS CloudWatch -
the
TaskRoleArnandExecutionRoleArnare important here, which we'll run through next
Prometheus task role
An IAM role assigned to an ECS Task manages permissions for accessing the AWS API. Since the prometheus-ecs-discovery container will make several API requests to discover ECS targets, we have to provide specific permissions. These are highlighted below:
  PrometheusRole:
    Type: AWS::IAM::Role
    Properties:
      RoleName: prometheus-role
      Path: /
      AssumeRolePolicyDocument:
        Statement:
          - Action: sts:AssumeRole
            Effect: Allow
            Principal:
              Service: ecs-tasks.amazonaws.com
      Policies:
        - PolicyName: ECSAccess
          PolicyDocument:
            Statement:
              - Action:
                  - ecs:ListClusters
                  - ecs:ListTasks
                  - ecs:DescribeTask
                  - ec2:DescribeInstances
                  - ecs:DescribeContainerInstances
                  - ecs:DescribeTasks
                  - ecs:DescribeTaskDefinition
                Effect: Allow
                Resource: '*'
Prometheus task execution role
A task execution role is provided to allow the ECS agent that manages containers to access the relevant AWS services in our account. In this case we're defining a role which allows the ECS agent to write logs to CloudWatch.
This can be achieved using the AmazonECSTaskExecutionRolePolicy managed policy, highlighted below:
  PrometheusExecutionRole:
    Type: AWS::IAM::Role
    Properties:
      RoleName: prometheus-execution-role
      Path: /
      AssumeRolePolicyDocument:
        Statement:
          - Action: sts:AssumeRole
            Effect: Allow
            Principal:
              Service: ecs-tasks.amazonaws.com
      ManagedPolicyArns:
        - arn:aws:iam::aws:policy/service-role/AmazonECSTaskExecutionRolePolicy
Prometheus Service
The ECS Service uses the above TaskDefinition. Remember that an ECS service manages instances of the TaskDefiniton and handles networking.
  PrometheusService:
    Type: AWS::ECS::Service
    Properties:
      Cluster: !Ref Cluster
      TaskDefinition: !Ref PrometheusTaskDefinition
      DesiredCount: 1
      LaunchType: FARGATE
      NetworkConfiguration:
        AwsvpcConfiguration:
          AssignPublicIp: ENABLED
          Subnets:
            - !Ref PublicSubnet
          SecurityGroups:
- !GetAtt PrometheusSecurityGroup.GroupId-
we're assigning a public IP to this Prometheus instance. Probably not something you'd do normally, but it simplifies the CloudFormation for now as we don't need to setup a load balancer resource.
-
the security group assigned to this service must allow access to port 9090, the default Prometheus port.
Prometheus service discovery for ECS in action
Now that we've run through the resources that need to be created, it's time to see this baby in action!
Launching the CloudFormation stack
Once you click the Launch Stack button, just click Next three times, accepting all the defaults. On the Review page select the checkbox to say that the stack can create IAM resources, then click Create stack.

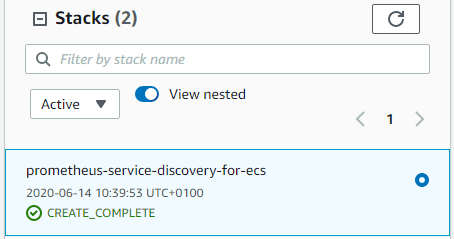
Your stack will now be in the CREATE_IN_PROGRESS state. After about 5 (potentially long) minutes the stack will be in the CREATE_COMPLETE state:
Viewing the metrics directly
Now we can observe the service discovery in action! Navigate to Services > Elastic Container Service and click on the service-discovery-example-cluster cluster name:
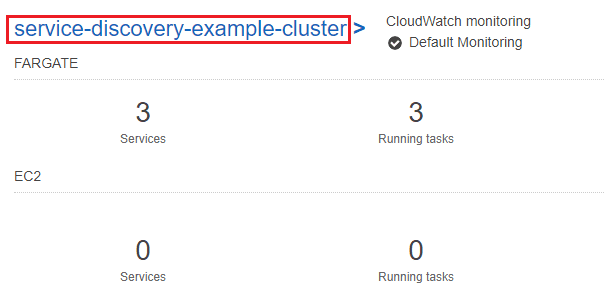
On the cluster details page we can see our three services:

There are the two services for our applications that are generating metrics, Service A and Service B, and one task for Prometheus with service discovery.
First, let's make sure our applications are generating metrics as expected. Click on the Service A Service Name, click on the Tasks tab, then click on the task id to get to the task details page:
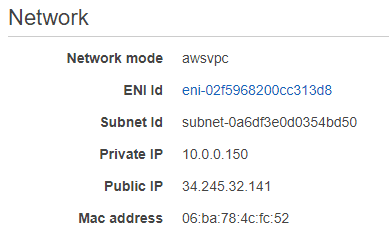
In the Network section you'll see a Public IP, which we can use to access the metrics endpoint at http://<public-ip>:8080/actuator/prometheus:

Looks like our metrics generating application is working as expected! 👍You can follow the same process to check Service B, if you like.
Viewing the metrics through Prometheus
Now we've had our confidence boosted by seeing the applications are generating metrics correctly, let's see what the scoop is with Prometheus. Follow the same process to get the public IP of Prometheus from the task details page.
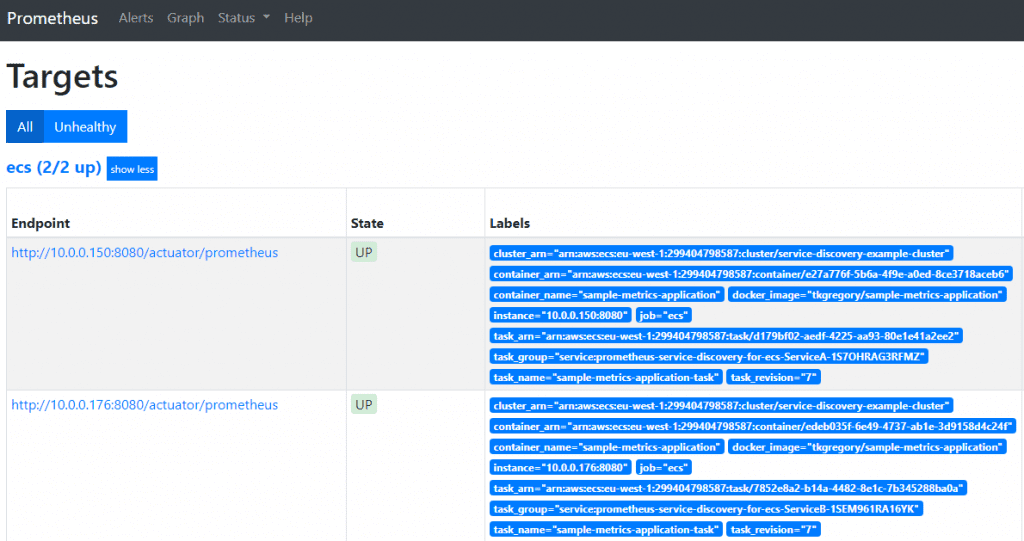
You can access Prometheus at http://<public-ip>:9090. Go to Status > Targets and you'll see that Prometheus is successfully scraping metrics from our two applications, thanks to service discovery:
Click on Graph and we'll try running a query against these metrics. Just enter the query into the text box and hit Execute:
sum(increase(http_server_requests_seconds_count[10m])) by (instance)
The query tells us how many requests have occurred to each application instance within the last ten minutes:

In this case we've had 10 requests to each of Service A and Service B, which makes sense since Prometheus is scraping metrics once per minute.
Checking the log output
If you needed any more proof to know that service discovery is working properly, we can take a quick look at the logs for prometheus-ecs-discovery.
Navigate to the Prometheus task as before, then select the Logs tab. Here you are given a drop down to select the container you want to see the logs from:

Select prometheus-ecs-discovery, and you'll see logs like this:

This shows that the ecs_file_sd.xml file is indeed being written as we expected. Also notice that the log repeats every minute, showing that the file is being kept up-to-date as ECS tasks are added or removed.
Tearing down the CloudFormation stack
Once you're done with this CloudFormation stack, don't forget to delete it by going to Services > CloudFormation, selecting the stack and then clicking the Delete button. This will avoid any unnecessary charges.
Another service discovery option using DNS SRV records
It's worth mentioning that there is another option for Prometheus service discovery for ECS, and that's using DNS SRV records. SRV records can be used to identify individual hosts behind a domain. ECS allows you to configure a discovery service which automatically adds an SRV record into a private namespace for each ECS task.

On the Prometheus side you can use the DNS-based service discovery configuration value dns_sd_config. This gets configured with a domain name which Prometheus then queries to get the SRV record values which resolve to the private IP addresses of the services.
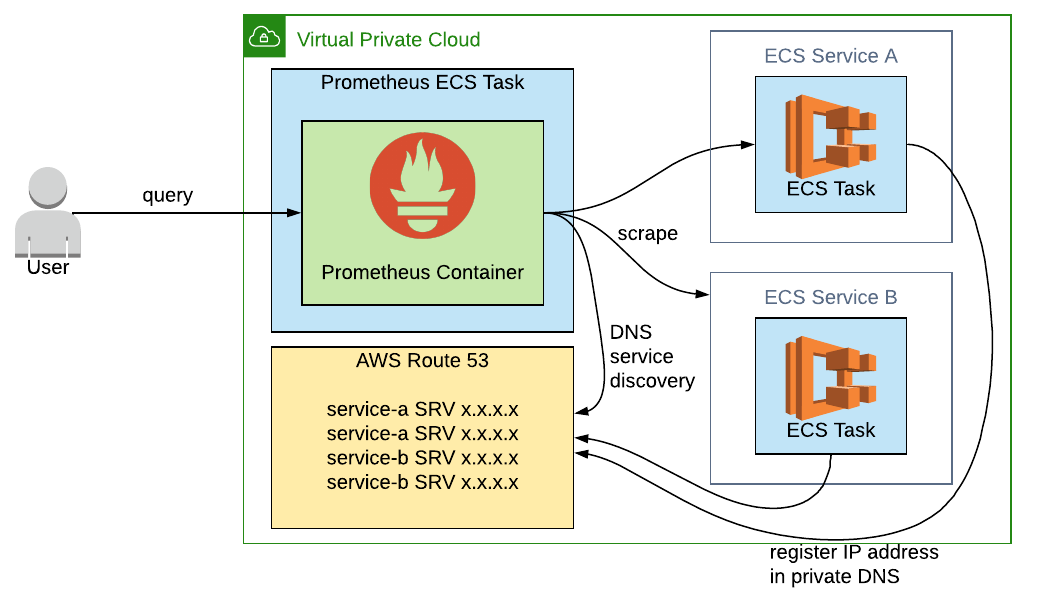
The downside with this approach, though, is that it only works if your service has eight or fewer records. Route53, the AWS DNS, will only return up to 8 records when the SRV request comes in. Not very useful if you plan to be operating at scale.
The other downside is that you still have to configure Prometheus with a domain name for each ECS service that you want it to scrape. The approach using the AWS API doesn't have this problem, as any new ECS tasks are discovered automatically as long at they have the correct Docker labels.
Comparison of two approaches to service discovery
| AWS API | DNS SRV records | |
|---|---|---|
| Supported by Prometheus? | Yes, but requires some additional tooling | Yes |
| Any limits? | None | 8 tasks per service |
| How much Prometheus Configuration? | Minimal | Must configure each ECS service separately |
Some final considerations
Please bear in mind that the CloudFormation provided is an example in order to demonstrate Prometheus service discovery in ECS, and doesn't represent a production-ready infrastructure. At a minimum, you'd also want to consider:
-
deploying all the ECS services to a private subnet
-
not assigning a public IP to the ECS services
-
using a load balancer such as AWS Application Load Balancer to access the ECS services
-
using strict security groups to control access between the ECS services
-
adding persistent storage to Prometheus, so your data is retained after a restart
At this point I hope you can see that although Prometheus service discovery for ECS isn't an out-of-the-box type solution, with some simple tooling it can be automated, leaving you to concentrate on more important areas.
Resources
CloudFormation
You can view the CloudFormation or launch the stack directly:
Docker images
In this example we used the following Docker images:
-
tkgregory/prometheus-ecs-discovery is the Docker image for the application that calls the AWS API and writes the targets to a file (link to application GitHub repo below).
-
tkgregory/prometheus-with-remote-configuration is Prometheus with the extra ability to load configuration from a remote URL
Read the docs
-
this Prometheus documentation details all the service discovery mechanisms it supports.
-
the prometheus-ecs-discovery GitHub repo contains the application that we used to call the AWS API and write the targets to a file.
If this is a problem you're dealing with in your own team, you can see how I approach software delivery in practice.
