Monitoring A Spring Boot Application, Part 2: Prometheus

As part of a monitoring solution you'll need a service to pull metrics from your applications, store them, and provide an easy way to query them. Prometheus is a tool which allows you to do all three. In this article you'll learn all about Prometheus, how to set it up, point it to your application, and query it.
If you want to see the high level overview of a complete monitoring solution for Spring Boot, check out last week's blog post. Today's blog post, and future posts in the series are a deep dive into the individual components required.
1. Overview
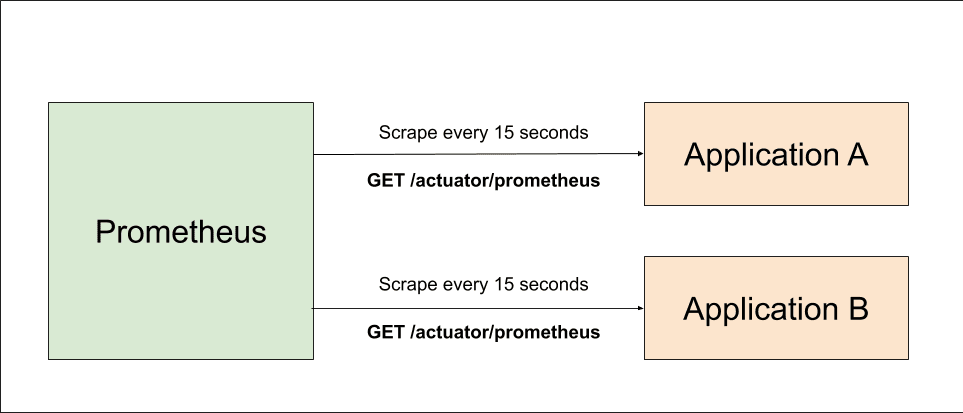
Prometheus is a service which polls a set of configured targets to intermittently fetch their metric values. In Prometheus terminology, this polling is called scraping.
The high level overview looks like this:

Prometheus can be configured to scrape metrics from however many applications you like. Once Prometheus has fetched the data, Prometheus stores and indexes it in such a way that we can then query it in meaningful ways.
2. Metric Syntax
An application must expose metrics for Prometheus on an endpoint in a specific format. In Spring Boot, this happens somewhat automatically for us when you follow the steps in the previous post. The endpoint exposed for Prometheus to scrape in Spring Boot is /actuator/prometheus.
An example metric looks like this:
http_server_requests_seconds_count{exception="None",method="GET",outcome="SUCCESS",status="200",uri="/doit",} 6.0
The format follows:
metric_name{labe1Name="label1Value",label2Name="label2Value",...}
-
http_server_requests_seconds_count is a metric to hold the count of HTTP requests (don't worry about the fact that the name contains the word seconds). To learn about other default metrics check out the Spring Boot default metrics article.
-
exception, method, outcome, status, and uri are useful labels that group similar metrics together. e.g. any request that is a GET request to /doit successfully returning 200 response will cause this metric to be incremented.
3. Query Syntax
Once a metric such as the one above has been ingested into Prometheus during its scrape process (which happens by default every 15 seconds), we're able to query it.
Basic query
In its basic form, the query syntax looks very similar to the metric syntax. For, example, to get all values of the http_server_requests_seconds_count metric I can run the following query:
http_server_requests_seconds_count
Which will return us the data below:
http_server_requests_seconds_count{exception="None",instance="application:8080",job="application",method="GET",outcome="SUCCESS",status="200",uri="/**/favicon.ico"}
9

http_server_requests_seconds_count{exception="None",instance="application:8080",job="application",method="GET",outcome="SUCCESS",status="200",uri="/actuator/prometheus"}
1

http_server_requests_seconds_count{exception="None",instance="application:8080",job="application",method="GET",outcome="SUCCESS",status="200",uri="/doit"}
10
This represents all the requests that have been made into the application, including:
-
a metric for the /doit request discussed earlier
-
a metric for the /actuator/prometheus request which is when Prometheus is scraping metrics from the application
-
a request to facicon.ico which Chrome requests by default
Query with labels
We can run a more specific query by adding labels, for example:
http_server_requests_seconds_count{uri="/doit"}
Only returns us the single metric associated with the /doit request
http_server_requests_seconds_count{exception="None",instance="application:8080",job="application",method="GET",outcome="SUCCESS",status="200",uri="/doit"} 15
Using the same syntax, you can probably see how we might run a query for the number of non-200 responses from /doit:
http_server_requests_seconds_count{uri="/doit",status!="200"}
Query with function
Prometheus provides us functions to run more elaborate queries. Here's an example of the rate function, which calculates the per-second rate, averaged out over a set time period:
rate(http_server_requests_seconds_count{uri="/doit"}[5m])
Info: the [5m] in this example is what's called a range vector selector. We're basically telling Prometheus to use metrics from the last 5 minutes only for our rate calculation.
This query returns the single row below, showing a rate of 0.15 requests per second. Not a very popular API!
{exception="None",instance="application:8080",job="application",method="GET",outcome="SUCCESS",status="200",uri="/doit"} 0.15
Another useful function is sum. If we were only interested in the rate of requests overall, and not specifically for the /doit URI, we could run a query like this.
sum(rate(http_server_requests_seconds_count[5m]))
Which returns:
{} 0.3416666666666667
The sum function adds up all the responses for all the different rate results. If we hadn't included sum, we'd get multiple rate results for each http_server_requests_seconds_count metric (/doit, /actuator/prometheus etc.).
4. A Working Example
Now you know a bit more about Prometheus, let's get it running and scraping metrics from a Spring Boot Application. If you want to follow along with this, you'll need Docker installed (check out the Docker website on how to do that).
We're going to use Docker Compose, as this is a really easy way to get multiple Docker containers up and running and talking to each other.
We'll use Docker 2 images:
- tkgregory/sample-metrics-application:latest which is a sample Spring Boot Application, exposing metrics on the standard http://localhost:8080/actuator/metrics URL
- prom/prometheus:latest which is the official Prometheus Docker image
Run the Spring Boot application
Create a file docker-compose.yml with the following contents:
version: "3"
services:
  application:
    image: tkgregory/sample-metrics-application:latest
    ports:
      - 8080:8080
This specifies we want a container called application using the tkgregory/sample-metrics-application:latest image, exposed on port 8080. We can bring this up now using:
docker-compose up
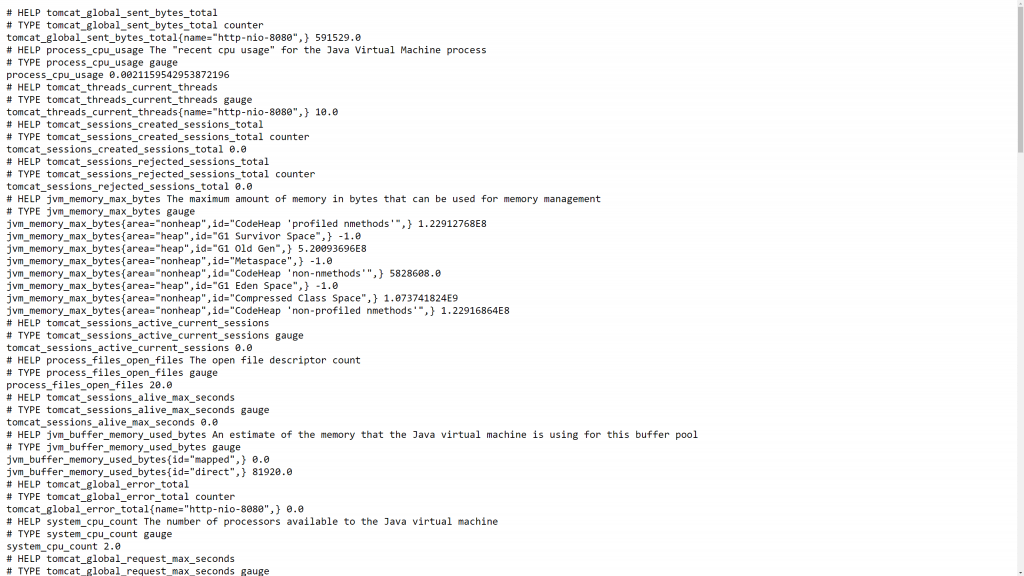
Hit http://localhost:8080/actuator/prometheus and you should see a page like this:

You can also hit http://localhost:8080/doit and if you want to get the http_server_requests_seconds_count metric going up and up!
Run Prometheus
First up, let's create a file prometheus.yml in the same directory as docker-compose.yml. This file will contain the configuration for Prometheus, specifically something called scrape_configs which defines where Prometheus should scrape the metrics from:
scrape_configs:
  - job_name: 'application'
    metrics_path: '/actuator/prometheus'
    static_configs:
      - targets: ['application:8080']
Info: Prometheus will be polling http://application:8080/actuator/prometheus for its metrics. Note that by default Docker makes the container name available as a hostname, to allow communication between containers.
That's all for now, so then add this section to the end of the docker-compose.yml:
prometheus:
  image: prom/prometheus:latest
  volumes:
    - ./prometheus.yml:/etc/prometheus/prometheus.yml
  ports:
    - "9090:9090"
Info: Here we're configuring a prometheus container on port 9090, mounting the local prometheus.yml configuration file inside the container at the default location expected by Prometheus.
Run docker-compose up again to also bring up Prometheus. You'll now be able to browse to http://localhost:9090 to access Prometheus.
Run Some Queries
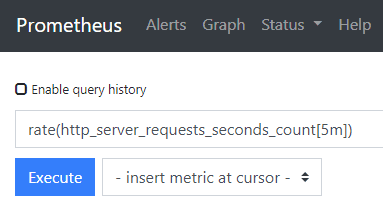
You can now try executing some queries that we talked about earlier on. For example, try the following query to see the rate of HTTP requests in the last 5 minutes for each request URI:
rate(http_server_requests_seconds_count[5m])
Enter the query into the text box labelled Expression and hit the blue Execute button.

You'll see results like these from the query:
{exception="None",instance="application:8080",job="application",method="GET",outcome="SUCCESS",status="200",uri="/**/favicon.ico"}
0

{exception="None",instance="application:8080",job="application",method="GET",outcome="SUCCESS",status="200",uri="/actuator/prometheus"}
0.016666666666666666

{exception="None",instance="application:8080",job="application",method="GET",outcome="SUCCESS",status="200",uri="/doit"}
0
If you see that, for example, /doit has a rate of 0, you can go off and hit http://localhost:8080/doit a few times. Then run the query again to see the updated value. Note that Prometheus is scraping by default every 15 seconds, so the value won't update instantly.
Graphing
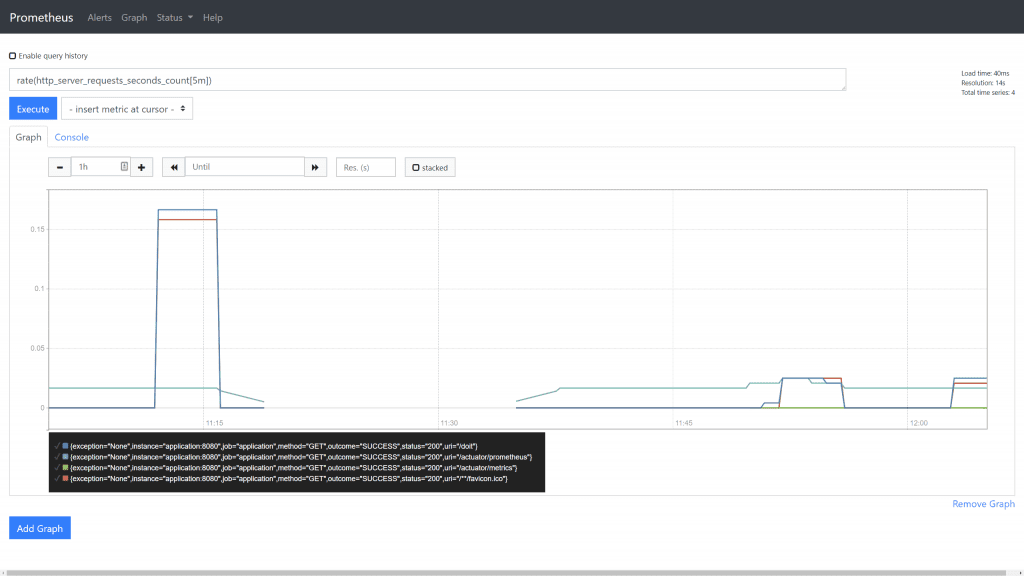
If you click on the Graph link once you've run a query, you'll see the data in a visual format:

This shows you the result of your query historically over the selected time period. This is a useful quick way to visualise data, but doesn't provide the full dashboard functionality we'll explore in a future blog post about Grafana.
5. Conclusion
You've seen how Prometheus gathers metrics, and is the central place where they are stored. It has an easy way to run queries against these metrics, and even see the output in a graphical format.
If you want to know when something goes wrong with your application, without having to constantly check your metrics, then the next article in this series will show you how to set this up.
6. Resources
Learn more about Prometheus over at https://prometheus.io/
If you prefer to learn in video format, check out this accompanying video to this post on the Tom Gregory Tech YouTube channel.
If this is a problem you're dealing with in your own team, you can see how I approach software delivery in practice.